Wednesday, October 26, 2011

BIRT Chart Palette

We have posted many times about the different facets of scripting (client and server side) for BIRT charts. Some of these posts are shown below. In many cases users want to modify chart colors based on some data value or some external logic. While this is very simple with the standard palette colors, some of the other palette options are not as straight forward. In this post we will discuss the different palette options developers have and how to access and modify them from script.

Previous Chart Scripting Posts


Chart Scripting Overview
Using Script to Modify a BIRT Chart
Dynamically Adding a Series to a BIRT Chart
Calling Client Side JavaScript From a BIRT Chart
More on Chart Interactivity

BIRT Palette Options


The BIRT Chart Palette supports standard and custom colors, gradients, images, positive/negative entries and patterns.

While standard and custom colors are simple some of the other types offer some interesting possibilities. The Gradient palette entry allows a start and end color as well as a rotation angle for the gradient.

The Image Palette entry allows a developer to specify a URL or embed an image directly into the chart model.

The Positive/Negative palette entry uses one palette color for positive values and one for negative values.

The Pattern palette entry allows the developer to define a pattern with foreground and background colors. The pattern can be one of the predefined patterns or one that is customized.

Palette Scripting


Many of the events that are triggered during the creation of the chart are passed a fill object. The actual data type of the fill object will depend on how the palette has been setup. The Fill object will be one of the following types:

org.eclipse.birt.chart.model.attribute.impl.ColorDefinitionImpl – Color/Custom Color Palette Entry
org.eclipse.birt.chart.model.attribute.impl.GradientImpl – Gradient Palette Entry
org.eclipse.birt.chart.model.attribute.impl.ImageImpl – Image URL Entry
org.eclipse.birt.chart.model.attribute.impl.EmbeddedImageImpl – Embedded Image Entry
org.eclipse.birt.chart.model.attribute.impl.MultipleFillImpl – Positive/Negative Entry
eclipse.birt.chart.model.attribute.impl.PatternImageImpl – Pattern Entry

For example assume that you have a Bar chart that uses one bar color and you want to change this color based on the Y-Axis value of the data point. The following beforeDrawDataPoint Script could be used.


function beforeDrawDataPoint(dph, fill, icsc)
{
//Fill implements Fill interface
//ImageImpl
//ColorDefinitionImpl
//GradientImpl
//MultipleFillImpl
//EmbeddedImageImpl
//PatternImageImpl

importPackage( Packages.org.eclipse.birt.chart.model.attribute.impl );
val = dph.getOrthogonalValue();
if( fill.getClass().isAssignableFrom(ColorDefinitionImpl)){
if (val < 40){
fill.set(255, 0, 0);
}
}
}


In this particular example the fill object is a ColorDefinitionImpl object that supports setting the R,G,B value of the color. Notice also that we import the org.eclipse.birt.chart.model.attribute.impl package to get access to the ColorDefinitionImpl class. If the palette entry was a gradient the script could be changed to something like the following:


function beforeDrawDataPoint(dph, fill, icsc)
{
//Fill implements Fill interface
//ImageImpl
//ColorDefinitionImpl
//GradientImpl
//MultipleFillImpl
//EmbeddedImageImpl
//PatternImageImpl

importPackage( Packages.org.eclipse.birt.chart.model.attribute.impl );
val = dph.getOrthogonalValue();
if( fill.getClass().isAssignableFrom(GradientImpl)){
if (val < 40){
fill.getStartColor().set(255,0,0);
}
}
}


In this example we set the start color of the gradient.

If you are using a Bubble chart with a Positive/Negative palette entry, by default one color will be used for positive values and the other for negative colors. You could alter this behavior for certain data points. For example the following script changes the positive and negative colors for some of the data points.


function beforeDrawDataPoint(dph, fill, icsc)
{
//Fill implements Fill interface
//ImageImpl
//ColorDefinitionImpl
//GradientImpl
//MultipleFillImpl
//EmbeddedImageImpl
//PatternImageImpl

importPackage( Packages.org.eclipse.birt.chart.model.attribute.impl );
importPackage( Packages.org.eclipse.birt.chart.extension.datafeed);
//for bubble chart this returns a BubbleEntry
val = dph.getOrthogonalValue();
yval = val.getValue()
if( fill.getClass().isAssignableFrom(MultipleFillImpl)){
if( yval > -500 && yval < 500 ){
fill.getFills().clear();
fill.getFills( ).add( ColorDefinitionImpl.BLUE( ) );
fill.getFills( ).add( ColorDefinitionImpl.WHITE( ) );
}

}
}


Notice that we needed to import the datafeed package as the bubble chart has size and value entries for the y-axis. We also used the ColorDefinitionImpl predefined colors for blue and white. We could have created the color using R,G,B values like ColorDefinitionImpl.create( 255, 255, 225 ).

Palette Model Location


While the above examples illustrate how to manipulate palette entries that are passed to the other events, it is often desirable to alter one or more palette entries. This can be done in the beforeGeneration event. How you access the chart palette will depend on what type of chart it is: Chart with Axes or Chart without Axes. For example suppose you want to replace the chart palette with a set of predefined gradients. To do this with a pie chart the following script could be used.


function beforeGeneration( chart, icsc )
{
importPackage(Packages.org.eclipse.birt.chart.model.attribute.impl);
sd = chart.getSeriesDefinitions( ).get( 0 );
sd.getSeriesPalette( ).getEntries( ).clear( );

sd.getSeriesPalette().getEntries().add( GradientImpl.create( ColorDefinitionImpl.create(220,237,248), ColorDefinitionImpl.create(80,166,218), 0, false));
sd.getSeriesPalette().getEntries().add( GradientImpl.create( ColorDefinitionImpl.create(255,213,213), ColorDefinitionImpl.create(242,88,106), 0, false));
sd.getSeriesPalette().getEntries().add( GradientImpl.create( ColorDefinitionImpl.create(255,247,213), ColorDefinitionImpl.create(232,172,57), 0, false));
sd.getSeriesPalette().getEntries().add( GradientImpl.create( ColorDefinitionImpl.create(213,255,213), ColorDefinitionImpl.create(128,255,128), 0, false));
sd.getSeriesPalette().getEntries().add( GradientImpl.create( ColorDefinitionImpl.create(213,255,255), ColorDefinitionImpl.create(64,128,128), 0, false));
sd.getSeriesPalette().getEntries().add( GradientImpl.create( ColorDefinitionImpl.create(226,226,241), ColorDefinitionImpl.create(128,128,192), 0, false));


}


In this example we clear the existing palette and replace it with a set of gradients. The palette is attached to the charts first series definition.
For a Bar chart the following script would be used.


function beforeGeneration( chart, icsc )
{
importPackage(Packages.org.eclipse.birt.chart.model.attribute.impl);

var xAxis = chart.getAxes().get(0);
var yAxis = xAxis.getAssociatedAxes().get(0);
var sd = xAxis.getSeriesDefinitions().get(0);

sd.getSeriesPalette( ).getEntries( ).clear( );

sd.getSeriesPalette().getEntries().add( GradientImpl.create( ColorDefinitionImpl.create(220,237,248), ColorDefinitionImpl.create(80,166,218), 0, false));
sd.getSeriesPalette().getEntries().add( GradientImpl.create( ColorDefinitionImpl.create(255,213,213), ColorDefinitionImpl.create(242,88,106), 0, false));
sd.getSeriesPalette().getEntries().add( GradientImpl.create( ColorDefinitionImpl.create(255,247,213), ColorDefinitionImpl.create(232,172,57), 0, false));
sd.getSeriesPalette().getEntries().add( GradientImpl.create( ColorDefinitionImpl.create(213,255,213), ColorDefinitionImpl.create(128,255,128), 0, false));
sd.getSeriesPalette().getEntries().add( GradientImpl.create( ColorDefinitionImpl.create(213,255,255), ColorDefinitionImpl.create(64,128,128), 0, false));
sd.getSeriesPalette().getEntries().add( GradientImpl.create( ColorDefinitionImpl.create(226,226,241), ColorDefinitionImpl.create(128,128,192), 0, false));
}


In this example the palette is attached to the series definition associated with the x-axis.
As a more complex example, and afterDataSetFilled script could be used to calculate the number of data points in a particular bar chart. The beforeGeneration event could then use this value to create a palette that gives entire chart a gradient look by moving a start color to an end color.


cnt = 0;
startColor = null;
endColor = null;
importPackage( Packages.org.eclipse.birt.chart.model.attribute.impl );

function afterDataSetFilled(series, dataSet, icsc)
{
importPackage( Packages.java.io );
importPackage( Packages.org.eclipse.birt.chart.model.type.impl );

if( series.getClass() == BarSeriesImpl ){
if( series.getSeriesIdentifier() == "Series 1" ){
var list = dataSet.getValues();
cnt = list.length;
}


}
startColor = ColorDefinitionImpl.RED();
endColor = ColorDefinitionImpl.ORANGE();
}
function buildPalette( mNumber )
{
var sr = startColor.getRed();
var sg = startColor.getGreen();
var sb = startColor.getBlue();

var er = endColor.getRed();
var eg = endColor.getGreen();
var eb = endColor.getBlue();

var nr = ((er-sr)/cnt)*mNumber + sr;
var ng = ((eg-sg)/cnt)*mNumber + sg;
var nb = ((eb-sb)/cnt)*mNumber + sb;

var nc = ColorDefinitionImpl.create( nr, ng, nb );
return nc;


}

function beforeGeneration( chart, icsc )
{
var xAxis = chart.getAxes().get(0);
var yAxis = xAxis.getAssociatedAxes().get(0);
var xSerieDef = xAxis.getSeriesDefinitions().get(0);
var ySerieDef = yAxis.getSeriesDefinitions().get(0);

xSerieDef.getSeriesPalette().getEntries().clear( );
for ( i = 1; i <= cnt; i++ )
{
xSerieDef.getSeriesPalette().getEntries().add( buildPalette(i) );
}
}


The example shown here are available at BIRT Exchange.

Tuesday, August 30, 2011

BIRT Contest

Last week at the BIRT road show in Bangalore, Actuate announced a BIRT contest. The challenge is to extend BIRT by building plug-ins that implement key extension points, like emitters, ODA drivers, charts and report items. The contest runs until October 15, 2011 and the details can be found on the Contest Wiki page.

Friday, August 26, 2011

BIRT Viewer Export Data

When using the AJAX based BIRT Viewer, a user has the option to show the table of contents, re-run the report with different parameters, export report data, export the report to XLS, PDF, PPT, DOC, PS, ODS, ODP, ODT formats, Print from the client, or print on the server. These options are available within the toolbar of the viewer.


The export data function allows the report user to export all the columns in the data binding collection for all data bound items in the report. To see the columns that will show up in the export, select the report item and choose the binding tab in the properties editor.


Within the Export Data dialog, users can configure the output encoding and separator to use when creating the output. Currently the separator supports comma, tab, semi-colon, colon, and vertical line separators.


By default BIRT will use the report element id to generate a name to populate the Available result sets drop down list. This is generally not a user friendly name. If the report designer names the report item in the general properties for a report item, this name will be used instead. In the image above the table is named “mytable”. By default all data bound items will be shown in the drop down list. BIRT provides an advanced property called Allow Export that can be set to true or false. If the value is true for a report item, the report items result set will be shown in the available result sets drop down. If the value is false, the result set will not be shown.


This property can also be set dynamically, using a beforeFactory script and the report elements name.


if( params["ExportChartData"].value == false ){
reportContext.getDesignHandle().findElement("mychart").setProperty("allowExport", false);
}
if( params["ExportTableData"].value == false ){
reportContext.getDesignHandle().findElement("mytable").setProperty("allowExport", false);
}


In this sample two Boolean report parameters are used to determine whether the allow export property should be set to false.


Other conditions can be used to make the decision on whether to display a report item in the available result sets drop down list. For example, from script you could call out to a Java object or access a session variable to make the decision.

The sample report is available at BIRT-Exchange.
Friday, July 29, 2011

BIRT Roadshow heads to India

If you are interested in some free BIRT training, some of the BIRT team will be in Bangalore on August 26th to do a workshop. Ray Gans, the Community Manager for Birt-Exchange.org, has posted the agenda on his blog.

To register for the event, visit the BIRT Roadshow registration site.

Tuesday, July 26, 2011

BIRT Developer Survey

Feedback from users is one of the key inputs into the BIRT planning process. By filling out this survey, you provide the BIRT team with valuable information on how you use BIRT and how you would like to see it evolve.

Survey should take less than 3 minutes to fill out.
BIRT Developer Survey

Thursday, July 21, 2011

Replacing the default BIRT XLS Emitter

If you are using the BIRT 3.7 runtime, the BIRT engine is now in one JAR. See the BIRT 3.7 New and Notable for more details.

While this is optimal for a lot of reasons, it does make it a little more difficult to replace the default BIRT emitters. We have seen this with many users wanting to use the Tribix emitters.

See this thread and this bug for an example of the issues. While replacing the emitter is achievable through the method described in the forum post, it is not very elegant. BIRT supports having two emitters that emit the same output format. When the engine processes a request for a specific output format the first emitter found by the runtime generally processes the request. This may not be desirable. To work around this a user can specify a specific emitter id to process the given output format. So if you have both the Tribix XLS and the default BIRT XLS emitter deployed you can specify which emitter to use to process the report. To illustrate how to do this, we will use the Tribix XLS emitter.

Deploy Tribix Emitter

First download the Tribix emitter and deploy it. If you are using the WebViewer with Version 2.6.2 or earlier, just copy:

org.uguess.birt.report.engine.emitter.xls_version.jar
org.uguess.birt.report.engine.common_version.jar

to the WebViewer/WEB-INF/platform/plugins directory.

If you are using BIRT 3.7 or later extract the following jars from the org.uguess.birt.report.engine.emitter.xls_version.jar.

xl-emitter.jar
lib/poi-3.5..jar
lib/commons-logging-version.jar
lib/commons-jexl-version.jar

Copy these jars to the WebViewer/WEB-INF/lib directory. Make sure they are no longer in the org.uguess.birt.report.engine.emitter.xls_version.jar. Finally, copy the modified org.uguess.birt.report.engine.emitter.xls_version.jar and the org.uguess.birt.report.engine.common_version.jar to the WebViewer/WEB-INF/lib folder.

Specifying Which Emitter To Use

The WebViewer provides a URL parameter, named __emitterid that can be used to specify which emitter to use for the xls format. For example:

This URL will use the default BIRT XLS emitter

http://localhost:8090/WebViewer/frameset?__report=test.rptdesign&sample=my+parameter&__emitterid=org.eclipse.birt.report.engine.emitter.prototype.excel&__asattachment=true&__format=xls

This URL will use the Tribix XLS emitter

http://localhost:8090/WebViewer/frameset?__report=test.rptdesign&sample=my+parameter&__emitterid=org.uguess.birt.report.engine.emitter.xls&__asattachment=true&__format=xls

This does not address the case when you are using the export button in the web viewer. In order to change which XLS emitter is used when the button is pressed, you will need to modify the
BirtExportReportDialog.js file in the WebViewer/ webcontent/birt/ajax/ui/dialog directory. Modify the __exportAction function to add the emitter id parameter to the request.


__exportAction : function( )
{
.
.
.
else
{
action = action.replace( reg, "$1=false" );
}
if( format=="xls"){
//action = action + "&__emitterid=org.eclipse.birt.report.engine.emitter.prototype.excel";
action = action + "&__emitterid=org.uguess.birt.report.engine.emitter.xls"
}

formObj.action = action;
formObj.method = "post";
formObj.submit( );

return true;
}


If you are using the Report Engine API, there is a render option available for setting the emitter id.


EXCELRenderOption options = new EXCELRenderOption();
options.setOutputFormat("xls");
options.setOutputFileName("output/resample/ps.xls");
options.setOption(IRenderOption.EMITTER_ID, "org.eclipse.birt.report.engine.emitter.prototype.excel");
IRenderTask task = engine.createRenderTask(document);
task.setRenderOption(options);


or


EXCELRenderOption options = new EXCELRenderOption();
options.setOutputFormat("xls");
options.setOutputFileName("output/resample/ps.xls");
options.setOption(IRenderOption.EMITTER_ID, "org.uguess.birt.report.engine.emitter.xls");
IRenderTask task = engine.createRenderTask(document);
task.setRenderOption(options);

Tuesday, June 21, 2011

BIRT 3.7 Released

BIRT 3.7 is now available and with this release many improvements and new features are available. BIRT 3.7 now provides a new POJO based runtime for ease of deployment when using the BIRT Viewer or the Report Engine. Open Document Text (ODT), Open Document Presentation (ODP), and Open Document Spreadsheet (ODS) outputs are also available with the addition of three new emitters. BIRT now provides support for Hadoop through a new Open Data Access Driver (ODA) that allows the developer to build queries using Hive Query Language (HQL) using the designer GUI.


To read more about these and other new features for BIRT, see the BIRT 3.7 New and Notable.

Tuesday, May 24, 2011

BIRT: Using XLS as a data source

BIRT currently supports many data sources, including XML, Web Services, JDBC and flat files. This list can also be extended by implementing BIRT extension points. Using this method is called implementing an ODA(Open Data Access) extension.

An ODA allows the developer to add custom GUI elements to the BIRT designer to create and manipulate a data source. This method is described in a set of articles located on BIRT-Exchange. BIRT also supplies a scripted data source that allows a developer to write code in a simplified interface to retrieve data using Java or JavaScript. This post explains how a scripted data source can be implemented to retrieve XLS data using the Source Forge Java Excel API project. For more information on using this API see this blog post.

Adding the JAR to the BIRT Project


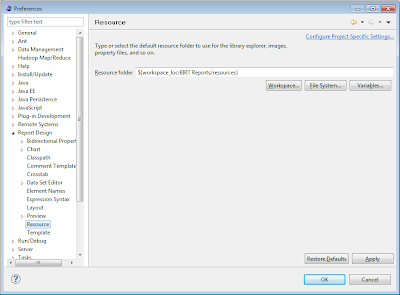
First download the Java Excel API and extract the jxl.jar file from the download. You can add this Jar to your BIRT project in several different ways. See this post for designer classpath options. One simple way to add the jar is to put the jar in your BIRT Project Resource folder and then add a reference to it in the report design. You can set the resource folder in the BIRT Designer Preferences (Window-Preferences-Report Design-Resource). The resource folder is also a web.xml setting in the deployed viewer.


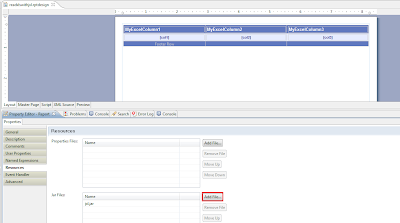
In the above screen shot we have a resources folder under the BIRT reports project. Just import the jxl.jar into this folder. To create the reference to the jar in a report design, select the properties view for the report and click on resources. Click the add file button in the jar files section of the report resources and add the jar.


The jar file should now be accessible in the designer from script or expressions. When you deploy the report to the Viewer make sure to copy the jar to the resource folder of the deployed Viewer.

If this method of adding the jar is not desirable you can always create a folder in the project containing the lib and add the jar to the project classpath entry (Window-Preferences-Report Design-Classpath). This will allow the jar to be accessed at design time. When deploying the report you can then just copy the jar to the WEB-ONF/lib folder of the deployed viewer.


Implementing the Scripted Data Source/Set


BIRT supports implementing a scripted data source in Java or JavaScript. In this example we implement it using JavaScript. Although the code is written in JavaScript we can still call Java code by using the importPackage method. This example uses this approach.

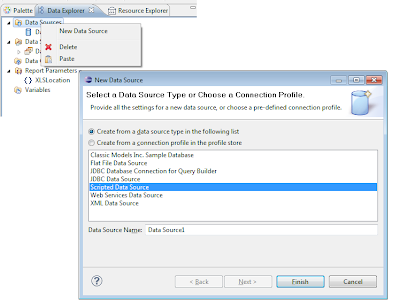
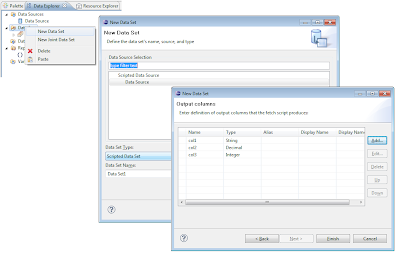
Use the new data source wizard to add a scripted data source and use the new data set wizard to add a new scripted data set. In this example we are reading a three column xls file, so we define 3 columns in our dataset.


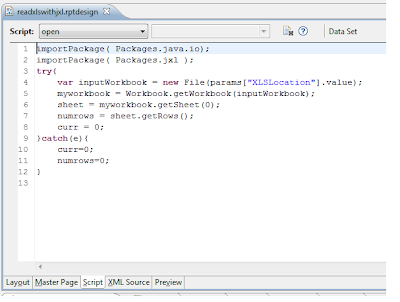
The final portion of this example requires that we add code to the script events to call the Java Excel API. Select the new data set and click on the script tab. From the drop down menu select the open event. Enter the following code.


importPackage( Packages.java.io);
importPackage( Packages.jxl );
try{
var inputWorkbook = new File(params["XLSLocation"].value);
myworkbook = Workbook.getWorkbook(inputWorkbook);
sheet = myworkbook.getSheet(0);
numrows = sheet.getRows();
curr = 0;
}catch(e){
curr=0;
numrows=0;
}


This code opens an xls file pointed to by the report parameter XLSLocation. You can hard code the file but this example is a bit more dynamic. The code then opens the first sheet in the workbook and sets a global JavaScript variable for the number of rows and initializes a current row counter to zero.


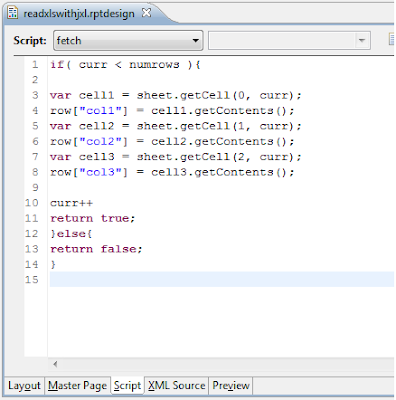
Select the drop down menu and select the fetch event and enter the following code.


if( curr < numrows ){

var cell1 = sheet.getCell(0, curr);
row["col1"] = cell1.getContents();
var cell2 = sheet.getCell(1, curr);
row["col2"] = cell2.getContents();
var cell3 = sheet.getCell(2, curr);
row["col3"] = cell3.getContents();

curr++
return true;
}else{
return false;
}


The fetch event is fired once per row of data and stops processing when the event returns false. In this code we are just retrieving the first three columns of the xls sheet and assigning them to the dataset row columns.


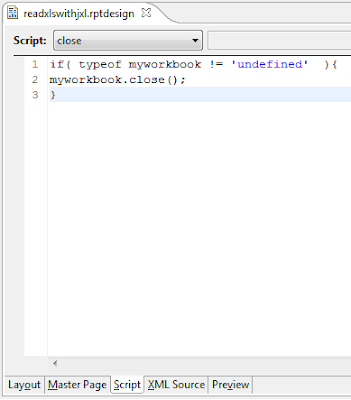
The final event to implement is the close event. Select close from the drop down box and enter the following code.


if( typeof myworkbook != 'undefined' ){
myworkbook.close();
}


This code closes the workbook.


You should now be able to preview the dataset.


Remember to add the parameter that defines the location of the xls file. Once the dataset is complete you can construct your BIRT report as usual. This attached example produces the following report.


This example is available at BIRT-Exchange.
Thursday, April 28, 2011

BIRT - Reducing large queries and custom navigation controls

Often times when writing a report that requires large amounts of data, the query times become burdensome. This will lead to dissatisfaction from customers of your report. To get around this issue certain companies like Actuate implement progressive viewing in their products that start returning formatted data before the report generation process is complete. This allows users of the report to start getting data long before the total report is completed.

Another option is to reduce the large queries into smaller queries and add navigation controls to your report to get the next smaller set of data. For example, if you have a customer listing report, the first query may return all customers whose name starts with the letter A. A set of navigation controls could have a next button that returns customers whose name starts with the letter B, etc. This approach is very simple in BIRT and this post details one way of doing it.

As an example we can use the classic models sample database that comes with BIRT. It contains a customers table. To return all customers starting with A we could use the query select * from customers where customername like ‘A%’. We want the report to be dynamic, so we will need script to modify the query on the fly. We can begin by just adding a new datasource that uses the classic models database. Next we create a dataset with the following query:

Select * from customers

The next step is to add a hidden report parameter that we use in script to add a where clause to the query. In this example the parameter is named “like”.


The parameter is hidden and has a default value of A. We can now use this parameter in the beforeOpen script of the data set we created earlier. This script should look like the following:

this.queryText = this.queryText + " where customername like '" + params["like"].value + "%'";

This script will change the query every time the report runs and will append the where clause with the hidden report parameter. The default value for the parameter is A which should list all customers starting with A. Before adding navigation controls to the report we need to create and calculate some global variables that our controls will need. Ideally we will add a previous and a next button to the report. In addition it would also be nice to have a list A-Z that the user could click on to go directly to a set of customers. So at the minimum when the report runs we need to get the parameter for the report and calculate what the previous and next customer names should start with. For example if the parameter is C, previous should be B and next should be D. This can be done with a simple beforeFactory script like:


switch( params['like'].value ){
case 'A':
prev='Z';
next='B';
break;

case 'B':
prev='A';
next='C';
break;

case 'C':
prev='B';
next='D';
break;
.
.
.
}


The beforeFactory script is used because it runs before data is retrieved and executes only once. The BIRT initialize script can be executed multiple times so it is not ideal for this script. The var keyword is also not used with the variables prev and next which will make them visible to downstream events. You could also use the reportContext.setGlobalVariable method to do store the variables as well.

After the table is added to the report you can then add a Text element that contains a script tag to implement your prev and next buttons.


Remember to set the type to HTML. The script tag contains a client side script that just reloads the report with a new value for the like parameter. This function is called nextData and takes the new like value as a parameter. The text element also contains two buttons that call the nextData function with the prev and next server side javascript variables we calculated in the beforeFactory. Notice this is done with the VALUE-OF tag. This tag allows us to combine server side scripting with client side scripting.


<script>
function nextData( a ){
var cl = new String(location.href);
var targetURL = new String();
var tst = cl.indexOf("&like");
if( tst == -1 ){
cl = cl + "&like=" + a;
}else{
var ch = cl.indexOf("&like=");
cl = cl.substring(0, ch) + "&like=" + a;

}
window.location = cl;
}
</script>
<input type="button" value="Previous"
onclick="nextData('<VALUE-OF>prev;</VALUE-OF>')" >
<input type="button" value="Next"
onclick="nextData('<VALUE-OF>next;</VALUE-OF>')" >


The last thing we add to the Text element is an Alpha index for all letters of the alphabet.


<br>
<a href="#" onclick="nextData('A');return false">A</href>
<a href="#" onclick="nextData('B');return false">B</href>
<a href="#" onclick="nextData('C');return false">C</href>
<a href="#" onclick="nextData('D');return false">D</href>
<a href="#" onclick="nextData('E');return false">E</href>
.
.


This allows the user to directly select a letter to use in the like clause. The output for the report looks like the following.


The report also handles the situation when no data is returned.


The no data label is placed in a grid below the table. The grid is bound to the table so it uses the same dataset. The dataset contains an aggregate computed column that counts the number of rows. This computed column is then used in the grid and the table visibility property.


For example the grid visibility is shown below.


The expression is:
(row["myrowcount"] > 0)
The expression returns true when rows exist. This will then hide the grid and label. The opposite condition is used on the table.
(row["myrowcount"] < 1)
This report is available at Birt-Exchange.
Wednesday, March 30, 2011

BIRT Roadshow coming to a city near you.

Actuate is continuing the very popular BIRT Road Shows that feature a free day of training on BIRT technologies. If you are interested, the dates and cities for April and May are listed below. Slots fill up fast so be sure to register quickly. More information is available here.

April
Seattle, WA Tuesday | 4/5
Minneapolis, MN Wednesday | 4/6
Indianapolis, IN Thursday | 4/7
Philadelphia, PA Wednesday | 4/13
May
Denver, CO Tuesday | 5/3
Toronto, ON Wednesday | 5/4
Princeton, NJ Tuesday | 5/10
Orlando, FL Wednesday | 5/11
Dallas, TX Thursday | 5/12
London, UK Thursday | 5/19
Louisville, KY Tuesday | 5/24
Washington, DC Wednesday | 5/25

Friday, March 04, 2011

BIRT 2.6.2 Enhancements

BIRT 2.6.2 is now available and is a maintenance release with a primary concern on bug fixes. This generally means not many new features are introduced. That said a couple of bug fixes merit special attention. The full list of available fixes can be found here.


BIRT Pagination and Page Scripts


BIRT 2.5 introduced page variables and page scripts. These features added the ability to repaginate based on things like a group change. So in one report output you could add a page variable that showed the page count and current group page number within a group. The full details for this feature are available in the BIRT 2.5 new and notable.

While using this feature is very nice, a particular bug caused the scripts not to fire when using a page break interval of 0. The page break interval is one of the many ways in BIRT to introduce a page break in the output. It essentially informs the engine to process a certain number of rows and then insert a page break. If the interval for a table is set to 0, the engine inserts page breaks when all the master page available real-estate is used. In BIRT 2.6.2 this bug is now fixed, allowing the designer to enter a page break interval of 0 in conjunction with page scripts.


The above example can be downloaded from BIRT-Exchange.

To see some of the pagination bugs that were addressed in 2.6.2 see this bugzilla query.


URL security bug


A security issue with the example Web Viewer was identified which posed a cross-site scripting vulnerability. The issue has to do with the __report URL parameter. This parameter specifies the report for the viewer to run. In previous versions of BIRT a fully qualified URL could be used to specify the report, which allowed the report to reside on a completely different server. Since BIRT reports can contain JavaScript which runs server side this poses a scripting risk. The full details for the bug are located here.
BIRT 2.6.2 fixes this issue by adding a web.xml entry that allows the developer to control what value can be used in the __report URL parameter. The entry is named URL_REPORT_PATH_POLICY and has three valid values (all, domain, and none). If the all value is specified no checks on the URL parameter are performed. This value should only be used when access to the viewer is restricted to a known user base. When the none option is used, only local reports to the viewer context for the server are allowed. When the domain option is used the report can contain a fully qualified URL as long as the domain for the server is the same.


If you cannot upgrade the viewer, the patch details are available in the bugzilla entry.


Formatter object


BIRT 2.6.2 now offers a formatter object in the expression builder to format dates, strings and numbers within a given expression. This function is detailed in the following post.


Radar Chart


The Radar Chart in BIRT was implemented in BIRT 2.6 to function as an example on how to implement your own chart types. The source for this chart type is available in two of the BIRT plug-ins (org.eclipse.birt.chart.examples and org.eclipse.birt.chart.examples.core). In BIRT 2.6.2 this chart type has been improved and it now supports rendering multiple series on the same radial within a radar chart.


The GUI for building the radar chart has also been improved to support a more optimal layout for configuring portions of the chart.

Friday, February 18, 2011

BIRT Formatting numbers and dates

BIRT offers many options when formatting data is required. This post discusses some of the common ways this can be done using the GUI, script and expressions.


Using the GUI to format data


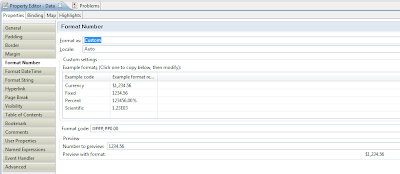
When formatting the standard Data report item, customizing the format is very simple. Located within the properties view for the data item are three tabs that allow formatting a number, date, or string. Which format the data item uses will depend on the data type for the data item as specified in the binding.


Each of the format tabs provides a set of predefined patterns that can be applied to the data. In addition, the pattern can be set to custom allowing the developer to define very specific formatting codes. The formatting operation can be set to a specific locale or auto which will use the locale of the user running the report. For example, entering ¤###,##0.00 as the pattern for a data item that is going to contain a currency may produce €131,44 for the French locale, and $131.44 for a US locale. For an example of using positive:negative patterns you may want to have a look at this post.

Report parameters selections can also be formatted in similar fashion to a Data report item. Each parameter has a “Format As” selection within the Parameter Editor. By selecting the change button a standard or custom format can be applied to parameter.


Formatting labels within the chart builder is also possible. Most items in a chart that display data have an associated format that can be customized by using the format button. For example to format a date axis use the GUI as presented below.


Formatting Data using the Expression builder or Script


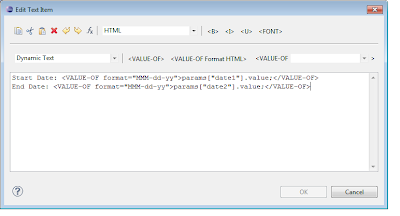
The above formatting solutions work very well, but there are times when you want to mix formatted data within a string. In this case you can write script, use and expression, or use a Text report item to format the data. For example assume a report has two dates that are passed as parameters and you want to generate text within the report that shows “Start Date – End Date”. This is not achievable using the GUI methods described above. To do this you can use a text item and the value of syntax:


Start Date: <VALUE-OF format="MMM-dd-yy">params["date1"].value;</VALUE-OF>
End Date: <VALUE-OF format="MMM-dd-yy">params["date2"].value;</VALUE-OF>


In this example the VALUE-OF syntax is evaluated at runtime of the report and the format attribute is applied to the output. This approach also works with numbers. For example, <VALUE-OF format="$#,##0.00">row[“MyData”];</VALUE-OF>.

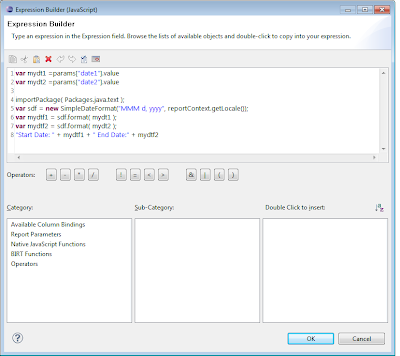
This same functionality could have been achieved by using a data item with the following expression.


var mydt1 =params["date1"].value
var mydt2 =params["date2"].value

importPackage( Packages.java.text );
var sdf = new SimpleDateFormat("MMM d, yyyy", reportContext.getLocale());
var mydtf1 = sdf.format( mydt1 );
var mydtf2 = sdf.format( mydt2 );
"Start Date: " + mydtf1 + " End Date:" + mydtf2


In this example we are just using the imported Java SimpleDateFormat class to do the formatting.

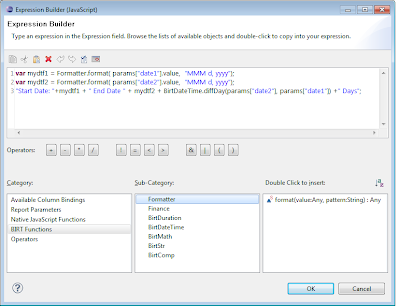
If you are using BIRT 2.6.2 or higher, you can use the Formatter function within the expression builder to format localized numbers, dates and string as well. The Formatter function is available within the BIRT Functions Category of the expression builder. To build the example above, use the following expression in data item.


var mydtf1 = Formatter.format( params["date1"].value, "MMM d, yyyy");
var mydtf2 = Formatter.format( params["date2"].value, "MMM d, yyyy");
"Start Date: "+mydtf1 + " End Date " + mydtf2 + BirtDateTime.diffDay(params["date2"], params["date1"]) +" Days";


In this example we have combined the start and end dates with the BirtDateTime.diffDay function to build a string that not only shows the start and end date, but shows the duration of days.

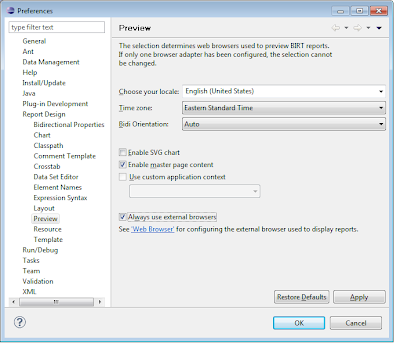
The Formatter function takes the current locale into account when formatting the element. If you want to test different locales, either set the preview locale in the preferences or use the __locale parameter in your report URL.


As a side note, if you are interested in adding your own functions to the expression builder, see this post.

You can also import Java classes to manipulate data points within the BIRT or Chart event handlers. For example to set your own format on an axis label the following script could be used on a chart.


function beforeDrawAxisLabel( axis, label, context )
{
importPackage(Packages.org.eclipse.birt.chart.model.attribute);
importPackage(Packages.java.lang);
importPackage(Packages.java.text);
if( context.getExternalContext().getScriptable().getParameterValue("MyParameter") == "date"){
if (axis.getType() == AxisType.TEXT_LITERAL)
{
value = label.getCaption().getValue();
var dtf = new SimpleDateFormat("MM/dd/yy");
var dt = new Date(value);
var fn = dtf.format(dt);
label.getCaption().setValue(fn);
}
}


As another example, the code below could be placed in a report parameter’s getDefaultValueList event handler to return the current year.


importPackage( Packages.java.util );
cal = Calendar.getInstance();
tyear = cal.get(Calendar.YEAR);
tyear;


Thursday, January 27, 2011

Changing Eclipse BIRT Indigo Version Number to BIRT 3.7

For the BIRT project’s Indigo release in June of this year, our plan continues to be to match the BIRT version number with the Eclipse Platform version number used for Indigo. Going forward, this will make it easier for everyone to remember which version of BIRT is designed to work with which version of the Platform. And with Indigo being the 8th major release of the BIRT project, there is no downside with updating the release number to match the Platform release.


At the outset of the Indigo project, it was an open question whether Indigo would be Eclipse 3.7 or 4.0 – so as a short term measure, we adopted BIRT 4.0 as the working release number for BIRT Indigo. Now that the Indigo release will be designated Eclipse 3.7, we plan to update BIRT Indigo to use the BIRT 3.7 designation.

Friday, January 14, 2011

Building BIRT Based Dashboards

If you are using Actuate’s iServer technology, one of the new features for version 11 is the ability to build dashboards using nothing but the browser. These dashboards can be constructed using open source BIRT reports, portions of a BIRT report, Flash Objects, Google Gadgets, and other web content. Completed dashboards and gadgets can be shared with others and can be included in other web applications using the Actuate JSAPI.

To start building a dashboard, select the new tab icon in the Actuate Information Console.


This will create a dashboard canvas as shown below.


By selecting the down arrow icon on the newly created tab, you can share the dashboard, rename it, set the layout or define data that will be used in the dashboard. Using the Options field will also allow you to set the refresh time for a dashboard. This can be used to present things like live charts or tables. The layout option allows you to define how the dashboard is presented. You can set a columnar option or freeform which allows you to place the gadgets anywhere on the canvas.


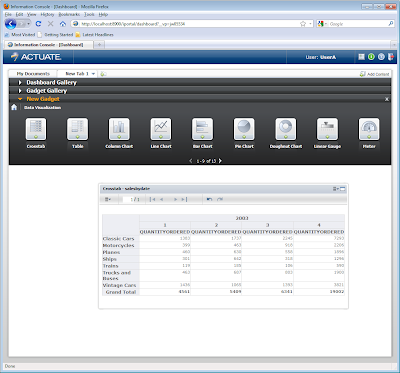
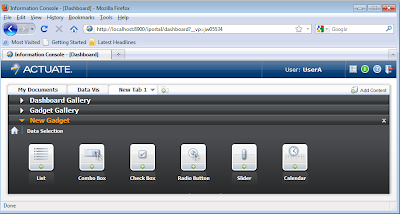
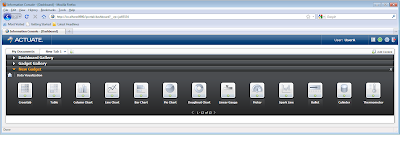
The Dashboard and Gadget Gallery menu items contain previously constructed items that have been shared. The New Gadget menu contains the Gadgets that can be placed on the canvas. There are four categories depending on what type of gadget you wish to use: Data Visualization, Data Selection, Report and Extras.


Data Visualization Gadgets


The Data Visualization category contains a set of gadgets that can be used to analyze data. These include a crosstab, a table, and a set of Flash charts.

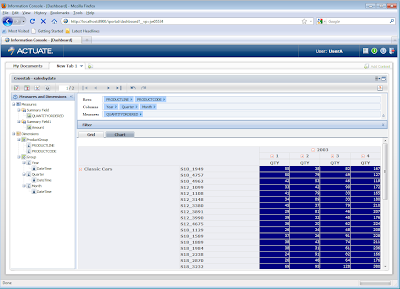
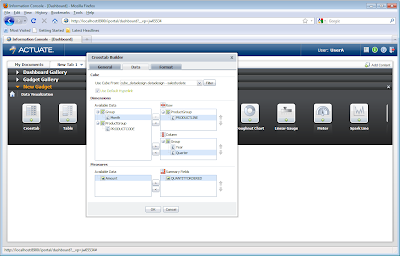
To use one of these gadgets, simply drag it to the canvas below the menu. For example, dragging the crosstab gadget onto the canvas will launch the Crosstab Builder.

The gadget retrieves its data from a data object or from an on-demand data design. The data design is essentially a set of BIRT data sources, data sets and data cubes. This allows you to leverage existing open source BIRT Reports as content for your dashboard. After assigning the design values for the crosstab you can move the gadget around the canvas to a suitable location.

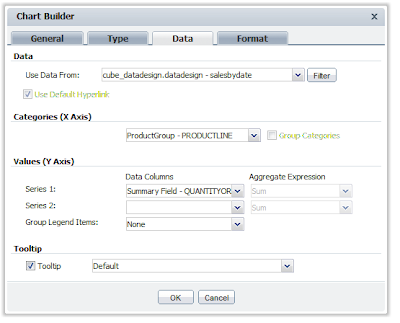
Placing one of the chart types will launch the Chart Builder, which allows specifying the chart data.

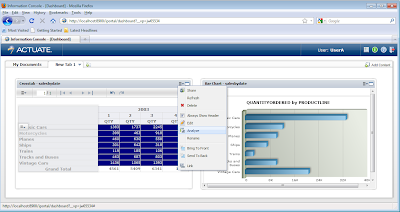
Most data visualization gadgets support further customization for filtering and formatting. In addition the data can be further analyzed by drilling into the data by clicking on actionable fields or by using the Actuate Data Analyzer.


Data Selection Gadgets


The Data Selection category contains a set of gadgets that present selection able data that can be used to drive other gadgets. These gadgets include items like lists, combo boxes and calendar selectors. To use these, just drag the gadget to the canvas and set the data similar to process used for Data Visualization gadgets.

Once the gadget is placed you can link it to another gadget by selecting the target gadget and clicking on down arrow in the upper right corner of the gadget and select link.

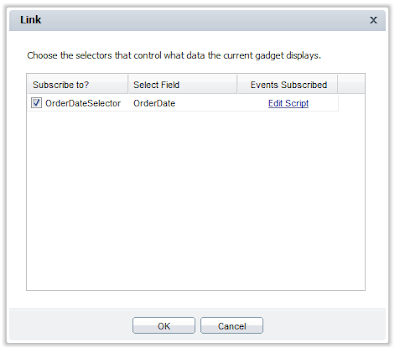
This will launch the link editor where you can set field in the target you wish to link on.

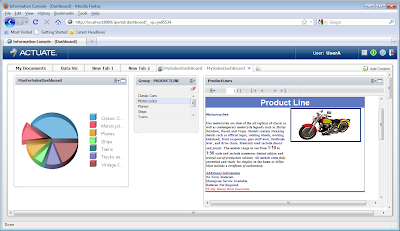
In this particular example the selector updates the report parameter OrderDate for the Report Gadget. Once the linking is complete any time the selector is updated the target gadget will get updated with the new value. Selectors can be linked to multiple gadgets. For example, in the following screenshot, the product line list selector updates an exploded pie chart and a detail report.


Report Gadgets


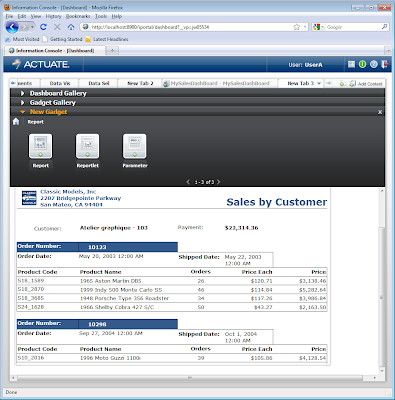
The Report category contains a set of gadgets that handle presenting BIRT report content. This can include BIRT designs or generated documents, which allows for a cached or on demand design paradigm. In addition the design or document can be further processed to only display a given object in a report or document. Finally a parameter gadget allows the user to use a gadget that displays the parameters for a particular report. This gadget can then be linked to a report gadget, which will be updated when the parameter gadget is changed.

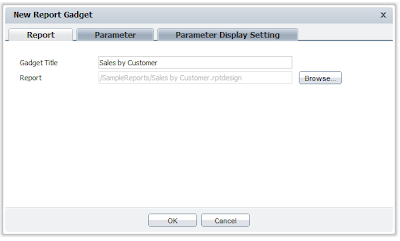
When dragging these gadgets to the canvas a New Report Gadget dialog will be displayed, this allows you to configure the location and parameters for a given report.

Using the refresh timer on the dashboard will also allow you to update how often the report is updated.

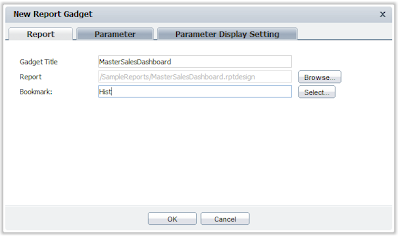
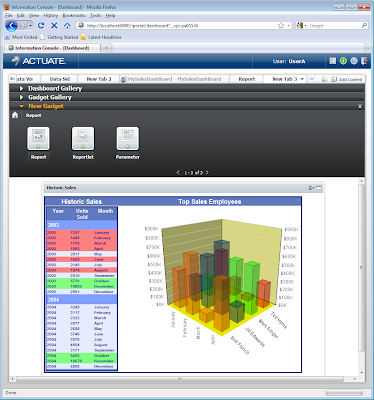
The Reportlet gadget allows the user to define a portion of a BIRT report or document to display. When using these one extra field is available in the New Report Gadget dialog. The field is the Bookmark field and corresponds with bookmark property for the report item in the BIRT report design.

In this example the bookmark Hist is located in the MasterSalesDashboard report design. The Hist bookmark in the BIRT report design corresponds to a grid report item that contains historic sales data.

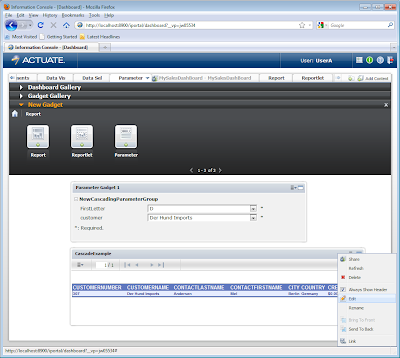
The Parameter gadget functions similarly to the Report and Reportlet gadgets, but only displays the parameter entry dialogs. Once you have a Parameter gadget and a Report gadget on the same canvas you can link them by editing the Report gadget using the down arrow in the upper right corner of the gadget.

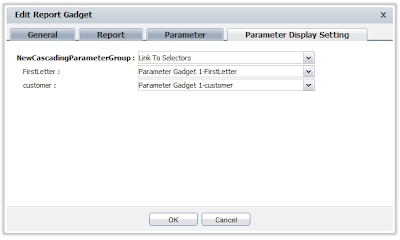
In the Edit Report Gadget dialog choose the Parameter Display Setting tab and in the first drop down select Link to Selectors. For each report parameter use the succeeding drop down menus to link them to the parameter gadget.

Once this is complete updating the parameter in the Parameter gadget will update the report in the Report gadget.


Extras Gadgets


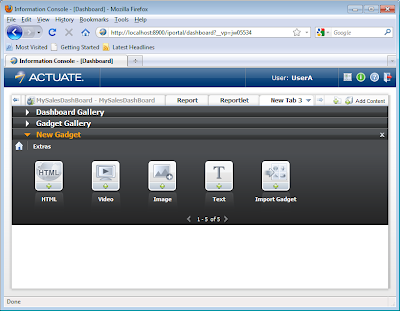
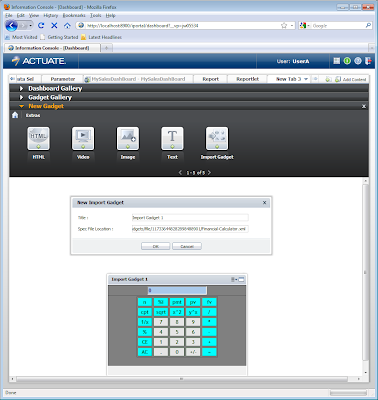
The Extras category contains a set of gadgets that allow you to include images, HTML, customized text, video and Google gadgets in the dashboard.

Each gadget will have a custom dialog for configuring the gadget. For example the Import Gadget item dialog allows you to specify the location for a Google Gadget.


Conclusion


This post is an overview of the building BIRT based dashboards using Actuate technology. If you want more details see the help documentation. If you want to try out this functionality download it from BIRT-Exchange.