The BIRT Team released milestone 2 of the BIRT 2.2 release a couple of weeks ago. With this milestone several new features were added that are very cool. We now have a BIRT Web Project Wizard that uses WTP technology to deploy the Web Viewer. Deployment is often stumbling block and ranks as one of the top questions on the BIRT News Group. Web integration will get more updates in later milestones. One in particular is the BIRT tag library, which will allow customized parameter pages and viewer attributes modifications.
Another very interesting project is the new ODA Project Wizards. Open Data Access drivers form the heart of data retrieval for the BIRT engine and are implemented using Data Tools Platform (DTP) project technology. Coding an ODA can be quite daunting to the initiate. These new wizards stub out a working sample ODA that can be customized to your needs. We will be blogging some more on this topic in the coming weeks.
These are just two of the projects in the 2.2 Project plan. Dynamic cross tabs and a new JavaScript editor are on the way. To read more about Milestone 2 features, take a look at the New and Notable Features for BIRT 2.2 Milestone 2
Thursday, December 21, 2006
BIRT 2 Milestone Features
Saturday, December 02, 2006
EclipseCon Long Tutorials
EclipseCon 2007 is in March next year. This is a great chance to go out and learn about the various Eclipse projects and to meet the people that are working to build the Eclipse Framework. The content for that program is selected through an open process using a modified version of Bugzilla named EclipseZilla.
Reporting has been given five slots for long talks (one hour presentations). Unfortunately we have 10 really good looking proposals. If you are interested in helping to determine which reporting topics will be presented at EclipseCon, please go to EclipseZilla and vote for your favorites.
Wednesday, November 22, 2006
Eclipse BIRT Awareness survey
The BIRT team is looking to better provide information about BIRT to the community and is looking for the feedback in the form of an Eclipse BIRT Awareness survey.
Please take a few minutes to fill this out. Thank you!
Wednesday, November 15, 2006
EclipseCon 2007
EclipseCon 2007 is scheduled for March of this year. The planning for the presentations is well under way. I have been involved in the planning process and have been completely over-whelmed by the quantity and quality of the material that has been suggested for the conference. At this point, the only categories that are formalized are the tutorial tracks.
Tutorials will be offered on the first day of the conference. They are divided into two categories, short tutorials are a two hour in-depth look at a particular subject. The long tutorials are full day presentations with a 'hands-on' component. For those of you who do not like conferences because they do not go into enough details, you should consider the EclipseCon tutorials. Looking at the submissions, we have had:
- 18 long tutorial proposals for 7 slots
- 63 short tutorial presentations for 39 slots
In terms of BIRT and the reporting project, there are five tutorial presentations that may be of interest:
The BIRT Long Tutorial is a full day demo/lab on how to work with the BIRT report development environment.
The short tutorials include are all focused on in-depth BIRT topics to either extend or integrate BIRT into web or stand-alone applicatons.
Eclipse Chart Engine API and Integration
Report Integration - The BIRT API's
Open Data Access - Extension framework for adding Custom Data Sources
Get Involved - Short and Long Talks
The EclipseCon committee will now be turning our attention on the content for the Long Talks (one hour) and Short Talks (10 minutes). The BIRT team has been given 5 long talk slots and 6 short talk slots. I would love to see talk proposals from our user community for both the long and short talks. If you are using BIRT and would like to share your experience, please submit a talk HERE.
Friday, October 20, 2006
Aggregate Update
When I did the Aggregate example, I noticed that I could not import the DataTypeUtil from the org.eclipse.birt.data project. To work around this, I just created my own DataTypeUtil class. I hate this kind of code, so I submitted a bug to have those class(s) exposed. It turns out that the issue is the way in which I was adding the dependency classes.
DataTypeUtil is in the org.eclipse.birt.data project, so this item needs to be added to your dependencies. In addition, DataTypeUtil throws a BirtException. So you need to add the org.eclipse.birt.core package.
But there is a catch. The org.eclipse.birt.core package has a filter that acts to block the inclusion of items from the org.eclipse.birt.data project. So it can not be the last item in the dependency list. I have asked the developers to look and see if they can resolve this issue.
Scott
Thursday, October 12, 2006
Building Crosstabs in BIRT
Update 07/2010
Details on BIRT Cubes and Crosstabs see this post.
The BIRT PMC Released the draft project plan for BIRT 2.2 last week. A Dynamic Crosstab Report Item is listed as one of the projects. This is an often requested feature and it is great to see that it is slated for the next revision of BIRT. That said, static crosstab reports can certainly be built using the current version of BIRT. Additionally, a fully dynamic crosstab can be built with the help of the Design Engine (DE) API, although the DE API approach requires a little more work and entails building or modifying a report design on the fly.
As background, Wikipedia states that a crosstab displays the joint distribution of two or more variables. In the world of reporting this usually means aggregating left to right and top to bottom.
What is often not stated is that a user is sometimes looking for the number of columns aggregated to be dynamic. We differentiate static crosstabs from dynamic crosstabs based on whether the number of columns in the crosstab is known at design time or at run time.
Krishna Venkatraman, from the BIRT team, supplied an example that is now posted on the BIRT web site that presents a neat static crosstab report. .
This report sums left to right and top to bottom. Additionally it is grouped by year and quarter. The columns of this report design were known before run time. To do the aggregration Krishna relied on the Total.sum built-in BIRT function. In each column the expression for the field is set to Sum(quantity ordered multiplied by price each). The Total.sum function allows a second parameter that filters what is included in the sum. In this case, the filter is set to the appropriate column.
For example, in the Planes column the expression is as follows:
Total.sum(dataSetRow["AllOrders::OrderDetails::QUANTITYORDERED"]*dataSetRow["AllOrders::OrderDetails::PRICEEACH"],dataSetRow["Products::PRODUCTLINE"]=="Planes").
This filters the values to only include planes within the sum. Additionally the BIRT Binding Editor allows further culling of the data by supplying an Aggregate On field, which allows the data to be aggregated on a group level. If the data element is in the Quarter group, the binding editor is set to only aggregate on the quarter. If the data item is in the Total, it aggregates all group levels.

To build a dynamic crosstab in the current version of BIRT, calls to the Design Engine API (DE API) are required. The DE API can be called from a Java application or built into a servlet. An example on the DE API Examples section of the BIRT Wiki should be a helpful starting point for this endeavor.
The Dynamic Report Servlet example shows how to open an existing report or template and add a table, data source and data set. The number of columns generated is decided at run time and are selected in the dynamic.html webpage.
After selecting the columns the form submit calls the example servlet which executes and displays the modfied report.
Adding column aggregations to create a true crosstab is an relatively simple extension, once you have a good understanding of how the DE API mechanism can be put to work to create dynamic tables.
Monday, October 02, 2006
BIRT Preferences
Report Design
As a developer, I look at my innate laziness as a virtue, I always try to automate the simple tasks. The BIRT report designer allows you to automate several of the routine development tasks through the preferences tab. I am just going to run the various preference options to illustrate what is available.The options for BIRT Reports can be found under Window => Preferences => Report Design. You can quickly see that there are several sub - dialogs under Report design.

The first sub dialog is to set up preferences for charting, logically entitled Chart. You have to options here. The first thing to note is that for the Chart, preview refers to the view of the chart within the chart editor. As you work with the chart editor, selecting data sets and fields, the chart editor by default will show data from the actual query, using up to 6 rows of data. When the report actually runs, in the Preview tab, these settings are ignored.
If you do not want to run the query to the data when you are in the chart editor, or if you would like to adjust the number of data rows used to create th e preview image in the chart editor, adjust this dialog appropriately.
Comment Template
I always like to leave a comment block on any code that I write identifying who created the code, when it was created, etc. Every now and then someone doing maintenance on code that I created will contact me with questions on something I have written. Unfortunately, in the rush to get things done, it is way too easy to forget this step.Fortunately, I can just set up my workspace to add the comments automatically. One less repetitive task to take care of.

Data Set Editor
The BIRT Data Set Editor dialog controls the behavior of all BIRT Data Set Editors. The first dialog controls the number of rows displayed in the preview dialog of the data set editor. This property is ignored when you a view a report using the Report Preview Tab.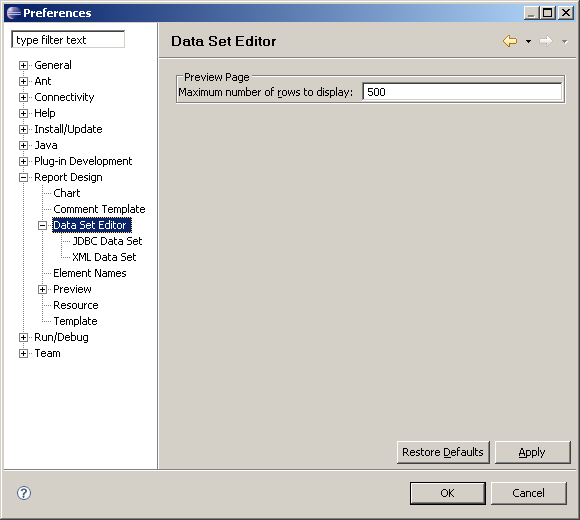
JDBC Data Set
The JDBC Data Set dialog queries the database server looking at the schemas, and the tables within each schema. This information is used to populate the Available Items and Schema fields of the JDBC DataSet dialog. In some cases, this query can be a very expensive and time consuming activity. The Report Design => Data Set Editor => JDBC Data Set allows you to control the amount of database meta data that the Report Designer will query.
If you lower the limits on these items, the table or schema that you would like to query may not show up in the Available Items area, or schema drop-downs. The unshown items are still available, but the developer will need to know the actual names and will have to write (or copy) the appropriate sql query.
XML Data Set
The XML Data Set will only pull in a limited number of rows from an XML data source.


Element Names
You can create custom name patterns for your BIRT elements. This is particularly useful if you plan on writing BIRT Script and you want to control the names of the controls. This topic was all ready covered in this post.
Preview
Okay this is the third time that I talk about Preview, and now I am actually going to talk about the preview that occurs when you run and view a report. The first interesting feature is for those report developers that will be deploying into multi-lingual environments. Through the locale drop-down, you can control which locale your report will use when it runs, without modifying the machine locale settings.The next check boxes control the report behavior when running in an external browser. Simply click on the Preview tab in the Report Perspective, brings up the standard built in report browser. When you run the report in a browser (through the File menu or the View Report icon) you will either use your default browser, or the browser of your choice.
The Maximum number of rows to display option works on both the Preview tab and when you View Report as HTML (File menu or Icon). Essentially, this allows you to see a section of a slow running report much quicker. This option does not impact a report when run in the Web Viewer or when run through the Report Engine.

Preview Server
Eclipse ships with a Tomcat web application server. This app server is used to server up the Eclipse help files. In addition, BIRT uses the web server to display reports in preview mode. By setting the server and port values in this dialog, you can allow other users to use the Tomcat server running under your Eclipse instance to preview report designs you have created. I have included the URL that you would use assuming that your server name is my_server and the port you want to use is 9999.
http://my_server:9999/viewer/frameset?
__report=c:\workspace\work_birt_sdk\my_reports\quick.rptdesign
&__format=html
&__svg=false
&__locale=en_
&__designer=true
&__masterpage=true
&__rtl=false
&__maxrows=500
&__resourceFolder=C:\Program+Files\Actuate\BRDPro\resources&-49158193

Resource
There are two basic types of resource files. Image files and localization properties files. These types of files are often shared between developers. Setting the Report Design => Resource => Resource folder allows developers to locate these shared files in a common network repository.
Template
Templates allow developers to simplify repetitive report design tasks. Typical team development environments will want to be able to create and share report templates. By default, templates are stored in the following directory:$ECLIPSE_HOME/plugins/org.eclipse.birt.report.designer.ui_version/templates
Modifying the report => templates location allows developers to share report templates from a common network location.
Tuesday, September 26, 2006
Optimistic Sums
Suppose you are developing reports for the Sales team. Your reports are providing insight into the sales channel. Your reports aggregate the sales estimates rolling the estimates up to the executive vice president of sales. The management team wants to see a bit more optimistic view of the sales forecasts. They ask you, "is there any way that you can manipulate the reports to provide a more optimistic view of the sales estimates."
Now my initial reaction would be one of alarm, "you want me to do what?" But then my curiosity would get a hold of me, is there a good way to do this? What is the best way?
First, you could create custom Birt Script sprinkled through out your reports that would round up the numbers as they are imported. Second, you could manipulate the data in the database either when you query it, or in the raw data. Third, you could create custom java functions to that you would integrate into your BIRT script. Fourth, you could make a Bugzilla entry and ask the BIRT team to add the new function.
Yes, there are a lot of ways that you could solve this problem, but there are issues with each method. None of them provide a really seamless way to customize your implementation of BIRT. Fortunately, BIRT ships with a standard way to add new aggregate functions to the basic BIRT Total functions. It is all done through the org.eclipse.birt.data.aggregation extension point. This post will walk you through the process of using the aggregation extension point to create your own OptimisticSum function and add it to your BIRT implementation.
The entire Eclipse Platform is built through a common extendable framework. In short Eclipse is made of a large number of plug-ins. Each plug-in can provide the ability to customize or extend its behavior through an extension point. When you create an implementation of an extension point, you are creating an extension. So BIRT is made up all of the BIRT plug-ins. Each BIRT plug-in has defined extension points where you can define new BIRT functions. What we are going to do is extend the org.eclipse.birt.data.aggregation extension point.
If you are interested in Eclipse extensions, there are a number of resources that you can use. In the standard Eclipse help, there are three guides that you may find useful: Platform Plug-in Developer Guide, JDT Plug-in Developer Guide, and the Plug-in Development Environment Guide all provide great information on plug-in development. In addition, "The Java Developer's Guide to Eclipse" provides a complete overview of the entire Eclipse plug-in development process.
Fortunately, you don't need to know that much to do a simple BIRT aggregate extension. I have created an eleven minute screen-cast that walks you through the entire process of creating a BIRT aggregate extension. You can find it here.
I also have a plug-in project that demonstrates the OptimisticSum control available here.
Here is an outline of the high level steps that are required to create a BIRT data aggregate extension:
1) Create a plug-in project
2) Add a dependency on the org.eclipse.birt.data plugin
3) Create an extension of the org.eclipse.birt.data.aggregation extension point
4) Configure the plugin.xml, here is a sample
<extension id="com.innoventsolutions.aggregate" name="TotalPlus" point="org.eclipse.birt.data.aggregation">
<aggregations>
<Aggregation aggregationClass="com.innoventsolutions.aggregate.OptimisticSum"
name="OptimisticSum">
<UIInfo parameterMetaInfo="String a, String b, String c" textData="Total.OptimisticSum()" tip="New Optimistic Sum tip~"/>
</aggregation>
</aggregations>
</extension>
5) Create an aggregationClass which either extends:
org.eclipse.birt.data.engine.api.aggregation.Aggregation
or implement the following interface:
org.eclipse.birt.data.engine.api.aggregation.IAggregation
If you are creating a single pass aggregate (one trip through the data) just extend the Aggregation class. If you need to do multiple passes over the data use implement the IAggregation interface.
6) In your aggregationClass implement the following methods
getName = name of the function
getType = 0 for Summary function, or 1 for Running function
getParameterDefn = is a boolean array, set to true for each required parameter.
newAccumulator = instantiate an instance of an Accumulator (see next step)
7) Create an extension of the
org.eclipse.birt.data.engine.api.aggregation.Accumulator
8) Implement the following methods in your Accumulator
getValue = returns the value that you have been accumulating
onRow = receives an array of parameters that you use to fulfill your function. For each row of data returned by your DataStream, the onRow event will be called one time.
9) Test / Debug your new plugin by running the project as an Eclipse Application. This will open a new instance of Eclipse. This new 'Runtime' instance of Eclipse will allow you to open up report designs and test your code. If you use the Debug Eclipse Application option when you test your plugin project, you will be able to step through your code, just like in standard Java development with Eclipse.
10) When you have completed your testing you can create a plugin jar by using the export feature on the project and export your project as a Plug-in Development => Deployable Plug-ins and fragments options to create a jar file. Simply dropping that jar file into the plugins directory of your BIRT deployment, and you custom function will be available.
Good luck creating your own BIRT Functions.
Scott
Tuesday, August 29, 2006
Building a Combination Chart with BIRT
A new screen cast has been added to the BIRT web site that demonstrates building a Combination Chart. This example uses a bar chart with a line chart superimposed. It also illustrates how drill to details can be implemented within a chart.
It can be viewed here.
Additionally the Charting FAQ is now available in the Eclipse Wiki.
The Charting FAQ explains many details on how the Charting Engine can be deployed, customized and manipulated.
Thursday, July 20, 2006
BIRT 2.1 New Features Webinar
We are putting together a webinar to demonstrate some of the new features in BIRT 2.1.
Joint Data Sets, Multi Data Set Cascaded parameters, New Charting features are just some of the topics that will be covered.
This webinar will be presented on Wednesday July 26, 2006. If interested
sign up and join us.
Wednesday, July 05, 2006
BIRT 2.1 New and Notable
As part of the Callisto release train, BIRT 2.1 is now available.
BIRT 2.1 expands on the 2.0 release, by adding features such as joined data sets, connection pooling, better drill through support, improved cascaded parameters, and enhanced charting. BIRT 2.1 also offers many improvements in internationalization, accessibility, and context sensitive help.
To read more about the new and improved featrues in BIRT 2.1 take a look at:
http://www.eclipse.org/birt/phoenix/project/notable2.1.php
Friday, June 16, 2006
Callisto Webinar Example Available
The source for the example covered in the first Callisto Webinar, Building Data Centric RCP Applications, is now available.
This example covers using the DTP and BIRT tools within an RCP application and illustrates this with an example that accesses an iPod library XML file.
Thanks to the Adobe team the recording can be accessed here.
Tuesday, May 30, 2006
Callisto Webinar
The Eclipse team will be starting a series or Webinars in June focused on the Callisto release. The BIRT and DTP teams have the pleasure of doing the first on June 5. We will be focusing on DTP, BIRT, and RCP integration.
If you haven't already signed up, check out Ian's Blog or go to the Eclipse site and register.
Wednesday, May 24, 2006
Joined Data Sets with BIRT 2.1
With the upcoming Callisto release BIRT 2.1 will support Joined Data Sets. Up to this point BIRT has supported multiple data sources, but did not present an easy way to join data from these data sources. If I were building a BIRT report that encapsulated HR data from an Oracle database and Financial data from a MS-SQL server, combining the data in a single output table was very cumbersome.
To address this problem the BIRT team has developed a new type of BIRT Data Set that allows joining of traditional data sets. The Joined Data Set allows the above scenario to be accomplished using Inner and Outer Joins between two data sets. A common key is defined, for join purposes, in the Data Set wizard.
Eg.
For simplicity I will use two CSV files as data sources. The CSV files have the following structure.
Rep_Region.csv
region, sales_repr
East, Rep_A
East, Rep_B
Central, Rep_C
Rep_Sold.csv
sales_rep,quantity_sold,quantity_purchased
Rep_A, 20, 22
Rep_B, 33, 44
Rep_D, 10, 10
The first file, lists the region and the sales rep. The second file lists the sales rep, the quantity of widgets sold and the quantity of widgets purchased from a supplier. Rep_C exists in the first file and not the second. Rep_D exists in the second but not the first. Also notice that the sales rep column name is different in the two files.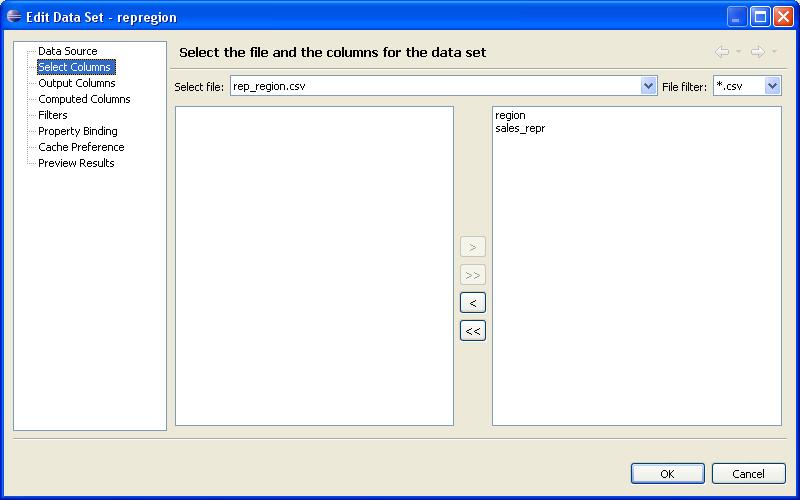
Create the first data set in BIRT using the CSV data source.
Create the second data set in BIRT using the CSV data source.
Create the new joined data set by right clicking on Data Sets and choosing “New Joined Data Set”.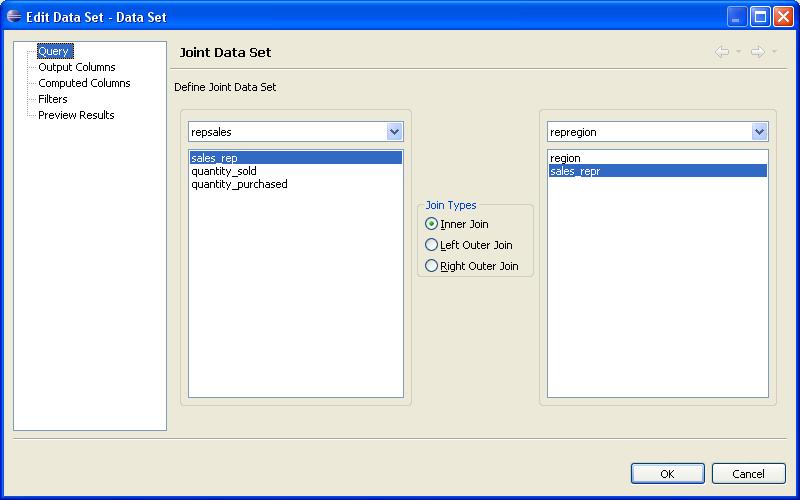
In the Data Set Wizard, map the sales_rep column from our first CSV file to the sales_repr column in the second CSV file. The data sets can then be joined using an Inner, Left Outer, or Right Outer Join.
Additionally, joined data sets support Computed columns and Filters.
After dragging the new data set onto the report the following output is displayed.
Inner Join.
Left Outer Join.
Right Outer Join.
This feature is available today in the 2.1 RC3 download.
Thursday, April 27, 2006
Get Some Style
In general, I have been working on proof of concept technical details in my BIRT reports. I figured that if I could get it to work, someone else would make it look good (typical developer). At the MySql conference I had the opportunity to present to the MySql users about BIRT, and I wanted my reports to look good. Not only that I wanted to make them look good quickly.
So I have a simple tabular report that looks like this: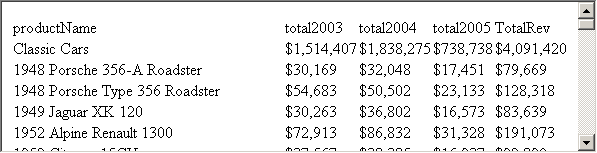
What I would like to do is format it to make it distinctive. I also want to do that in as few operations as possible. The slowest way that I could do it would be to go through the property editor setting properties on each of the controls.
Clearly the property editor works, but it involves a lot of mouse clicks. So the next approach would be to create Styles and apply the style to each row. This technique is significantly faster, but it is still not fast enough.
What I really want to do is just apply styles using Cascading Style Sheets. If you select the table element you will see that under Style one of the options is Import CSS. Seems like this would be a reasonable selection.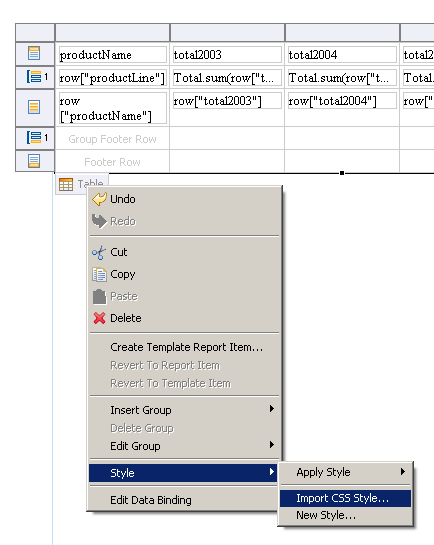

When you select this option, it brings you to a menu which has you select a CSS file and then gives you an option to select certain elements within the style sheet. Doing this will add style to your report as shown in the outline view.
Now if you do this, you can select each element (row, cell, etc.) and apply a style from your list of styles, but the styles that you import will not automatically be applied to your tables. This is because that the BIRT elements have standard names associated with each slot. In order for your style sheets to automatically be applied to elements in your report you have to use these standard names.
The only place I found this documented was in the PredefineStyle class of the model.metadata. I grabbed the JavaDoc comment here for your review:
BIRT defines a fixed set of predefined styles. These style correspond to certain report elements, or element slots. For example, there is a style * for chart, for list headers, for table footers and so on.
The set of predefined styles is part of the element design and is fixed by the development team. Fixed properties of predefined styles includes the internal name and display name. However, the property values for the style are set in a design or template and are part of the design itself.
This class represents the invariant part of the predefined styles. It is used to create a style element within a new design.
Note that predefined styles are identified with an internal name of element name, slot name or their combination. For example, to select a list, use the "list" style. To select a list header, use the "list-header" style. Styles also have a display name id which is used to get localized display name, but the internal name remains fixed across all locales. This ensures that a design created in one locale can be used in another.
So the way I read this, is if you use the invariant name of the pre-defined style than you do not need to go through the clicks of applying the style, your styles will be automatically adopted when you import the style. I tested this and when I used the appropriate names in my CSS, my report design changed from the unformatted text shown at the top of the screen to the following:
So I was able to do all of this in seven mouse clicks, I think that is getting really close. Now it is not perfect (don't shoot the messenger) but it is close.
The one major problem that I see with the current implementation is that you are not actually using the CSS when you do the import, instead you are making a copy of the CSS classes and id's into your report. This means that if you make a change to your CSS, that change will not be propogated to the reports. The only way to refresh your styles is to delete all of them and re-import the new styles.
It appears that the solution is to import the style into a library, then you should be able to use the library within your report. So far, I have not been able to get this to work, but it looks like there has been some on-going work in the 2.1 build that is aimed at addressing this. I will be testing the functionality in one of the next 2.1 builds and will report back if there are any changes.
If any one has had better luck with styles, please let me know.
Finally, in case you are unable to guess at the proper invariant style names, I have provided the names that I have used successfully.
.table-header
.table-detail
.table-footer
.table-group-header-1 (can be nested 1-9)
.table-group-footer-1 (can be nested 1-9)
Good luck,
Scott
Friday, April 07, 2006
BIRT and the eval command
While JavaScript’s eval function has been around for quite some time, I thought it might be a good idea to show an example of it working with BIRT. BIRT uses the Rhino engine for server side scripting and has an event model that allows writing handlers in JavaScript or Java. These handlers will be executed at key locations during the report generation and rendering processes. When implementing these in JavaScript the developer has access to the JavaScript native functions. The scripts that are implemented are stored within the XML report design. In addition to the event handlers, the BIRT Expression Builder uses JavaScript. The Expression Builder is used to assign values or modify attributes for a report element.. For example, evaluating the URL for a hyperlink or setting the value of a Data element is accomplished using the Expression Builder. The key to the expression builder is that it always returns a value. This is generally just a data value like row[“CustomerNumber”], but it also supports conditional logic and access to native JavaScript functions.
This gets me to the eval function. What if I want the script that executes in the expression builder to be dynamic? This may be useful when the calling application desires a certain Java class, not know at runtime, be loaded or the script that is used needs to be customized at runtime. This can be achieved in BIRT by adding a string parameter to the report that contains the script and using eval on the Expression Builder where the script is needed.
To illustrate I have created the following simple Java class. I will be using the getter methods for each of the three test cases. The first returns an int, the second a String and the third a HashMap. Make sure that this class is in WEB-INF/lib directory for the viewer plugin.
package my.simple.code;
import java.util.HashMap;
public class EvalTest {
private int testOne;
private String testTwo;
private HashMap testThree;
public int getTestOne() {
return testOne;
}
public String getTestTwo() {
return testTwo;
}
public HashMap getTestThree() {
return testThree;
}
public EvalTest() {
testOne=5;
testTwo="My Test String";
testThree = new HashMap();
testThree.put("hm0", "Test String Map 0");
testThree.put("hm1", "Test String Map 1");
testThree.put("hm2", "Test String Map 2");
}
}
Now create a report with the following elements.
Element - Value
Label – “Command to be Executed”
Data - params["JavaScriptEvalCommand"]
Label – Results of Command
Data - eval(params["JavaScriptEvalCommand"]);
Next add a String Parameter named JavaScriptEvalCommand and set its default value to
x =new Packages.my.simple.code.EvalTest(); y=x.getTestThree(); y.get("hm2");
Run the report. The output will be as follows:
Command To Be Executed
x =new Packages.my.simple.code.EvalTest(); y=x.getTestThree(); y.get("hm2");
Results of the Command
Test String Map 2
Now change the parameter to call test one and two, and the results should reflect what is in the Java class.
Parameter Value or test one and two:
x =new Packages.my.simple.code.EvalTest(); y=x.getTestTwo();
x =new Packages.my.simple.code.EvalTest(); y=x.getTestOne();
Using eval is powerful, but it does come with some drawbacks. First and foremost is that report debugging becomes more complex. Using a Java Event Handler is probably a better solution in most cases. Another issue when using the eval function within the Expression Builder is that you can only return one value. Finally parameter validation can be very difficult.
Monday, April 03, 2006
BIRT 2.1 Release Plan Update
Release 2.1 of BIRT continues to move forward. The development team has been hard at work re-factoring the project to adopt the new packaging aspects that are a part of the Callisto release. The next release of BIRT will be the RC1 release.
As stated before, the primary function that the 2.1 build addresses is to achieve compatibility with the Callisto Synchronization release.
That said there are some new features and fixes that are fairly exciting in the 2.1 release are. For those of you that do not want to have a look at the full document, here is a list of my favorites:
- Reportlet HTML Output: partial DHTML pages
- Improved Page Breaks: particularly for the html reports
- Total Page count
- Enhanced ODA support: BIRT is moving to the DTP ODA 3.0 Framework
- Join Two Data Sets: BIRT report developers can now join data sets
- Simplify Java Event Handler creation: As easy as doing File New -> Other -> BIRT ...
- Multiple Master Pages: Your report can now have portrait and landscape orientation in the same report
This is just a small set of the new functions, please have a look at the full project plan if you are interested. In addition to these fixes, the BIRT team has identified a number of fixes and other enhancements that are targeted for the 2.1 release. Please go to the project planning page if you want to check on the status of the fixes targeted for each release of the product
Tuesday, March 28, 2006
Recovering from EclipseConsternation
Dictionary.com defines consternation as a state of paralyzing dismay. Ok this has to do with fear, but I needed a "Con" word and it seemed appropriate. The number of projects and companies embedding and working with Eclipse is dizzying. Eclipse projects and plugins that do amazing things are popping up everywhere and it appears that we may be only scratching the surface.
Being on the BIRT PMC, my chief responsibility is BIRT and its adoption. It was very informative to see what some BIRT users are doing with the technology. Of particular interest is the JFire project. JFire is an Open Source ERP system focused on distributed trading. The JFire client contains a customized BIRT Perspective. This allows their users to customize report layouts and save them to the JFire server. Additionally they developed and ODA to read JDO objects, which JFire is based on. Last but not least reports are displayed in a browser or the JFire RCP application. This is a project that is definitely worth taking a look at, especially if you are in the process of embedding BIRT.
Friday, March 24, 2006
Control Your Element Names
For most people, the default element names are just fine. Typically, I write a lot of code because I am trying to show off features of the language. For me, it is easier to use standard and distinct names for all of my report elements. For example, when you add a new DataSource to your project you get the following dialog:
The name of the DataSource is "Data Source". I like all of my DataSources to start with the prefix src and then have a logical name to the DataSource, so I would name this srcClassic. So what I do is I go in and delete the word Data Source, and change it to src.
Fortunately, there is a better way. If you go to:
Windows -> Preferences -> BIRT -> Element Names
you can specify the basic name that is used for any of the BIRT report elements. This makes it easy to create a common set of prefixes to your elements.
I have changed all of my DataSource elements to start with src and all of my DataSet elements start with set. I use ssrc and sset for ScriptedDataSources and ScriptedDataSets. Once I have made this change, I get a new base name for my data sets.
When I create a new DataSrc after applying these changes to the editor, I get the following dialog.
Now my DataSet starts with a prefix of src, all I need to do to change this is add my standard name. This allows me to impose a bit better naming standards on my designs.
This is also a great place to start learning about the differences between the different types of report elements that make up a report. As you start to add prefixes to all of your report elements, you will start to see how each of these elements maps to the Report Object Model.
Scott Rosenbaum
Java and Session Objects in BIRT
One of the discussion in the BIRT In Depth tutorial was the use of java objects (pojos) and session objects within a BIRT report. To demonstrate these functions, I created two reports. The first is named java_object_integration.rptdesign and it uses the java.lang.System object to get the properties of the system and display them in the report.
The second uses a Java Event Handler to load a hashtable. The hashtable contains additional hashtables (request attributes, request parameters, session attributes, and System properties). These name value pairs are then displayed in the report design.
I have high hopes of writing this up in a more formal manner for display on the BIRT web site, but I am pretty busy right now. I have noticed a number of posts on the newsgroup asking for this information, so I am going to just put the reports are here without explanation. Hopefully someone will find this useful. If anyone is feeling ambitious and wants to write this up, please do and I will publish your contribution to the BIRT web site.
To have a look at the files download the following file: pojo_data_source.zip.
The first example of using a pojo only is fairly easy, just use the java_object_integration.rptdesign. It should run in your environment and give you a report of the System properties.
The next example is a little more complicated. The logic to build my data stream was easier to do in Java so I wanted to use Java Event Handlers. The java files that are in the zip directory will need to be in the source directory of your project, yes it needs to be java project. If you need some help you might try the documentation on Java Event handlers or you can wait until after the weekend when I update this.
Sorry for not finishing tonight, but I have not seen my family all week and there will be a rebellion if I don't attend to the important things (Sam is 2.5 and Louise is 4).
If you want to see a quick picture here is the report that uses a POJO to get the system properties:
This is a screen capture of the report that gets information from the request and session objects:
Thursday, March 23, 2006
Birds of a Feather; What a difference a year makes
One year ago, BIRT had just dropped the M1 build of the 1.0 product. At our first Birds of a Feather discussion on BIRT we had two attendees with four BIRT team members. This year, we still had four BIRT team members, but we now had 20 attendees.
Thanks to all of you that came out and shared how you are using BIRT, and what your hopes are for BIRT.
Paul Clenahan from the PMC lead the meeting with a review of the product direction and a short discussion about Bugzilla. What a difference a year makes, last year BIRT was using an internal bug tracking system and there was just a little bit of fear associated with the bad exposure that could be caused by showing all of our bugs (dirty laundry). This year, the message from the BIRT team has been very clear, if you want to get something done in BIRT you have to log it in Bugzilla.
For those of you who have not used Bugzilla, it is not just for bugs. Bugzilla is the way features, enhancements and changes to the product are tracked (yeah, we use it for bugs too). Every bug that is submitted is carefully reviewed and tracked to a resolution. We also encourage our community to discuss their requirements. The more clearly you can state what it is you would like and how you will use it, the better the chances that we can get it into the product. Use Cases, pseudo code, sequence diagrams... All of these tools help the project team to shape the product.
One other useful technique is that if you submit an enhancement and would like to see some discussion, post to the newsgroup with a link back to the bugzilla entry. You can also include either Jason or I on the cc. list and we will post about it here in BirtWorld. (jweathersby@actuate.com, scottr@innoventsolutions.com). If you do get involved in a bugzilla feature discussion, please vote and let us know how where you stand.
After discussing Bugzilla, we opened up the floor looking for examples of how people were using BIRT as well as what they thought they might use BIRT for in the future. We also asked what were the three things that people really like about BIRT and what were three things that BIRT could do better (and then we asked the participants to log their requests into Bugzilla).
Some of the themes from what people like in BIRT:
- Integration with Eclipse
- Separation of data connection from data bind (Sql etc.) logic
- Output formats
- Feature set
- Ease of use
- Tabular layout paradyne
- Pagination
- The friendly and profesional BIRT team (okay no one said that, but I know you were thinking it)
Some of the things that we could do better:
- More examples (we have a bunch of great examples from the presentations that we are going to publish).
- Better packaging in the run time engines (charts and engine) to make it easier to deploy and use, the biggest complaint was the use of the plug in architecture, which is great in Eclipse, but not so good in other apps.
- A need to improve the Script editor (we are working on this for 2.1)
- The ability to debug JavaScript code (we are looking for a contributor)
- A suggestion was to provide more focus on the use of BIRT in non Eclipse / non-web environments e.g. Swing apps.
There was a great discussion to add new charting constructs for diagram constructs. A lot of the BIRT consumers want to create reports about systems that are best visually represented by diagram objects (think sequence diagrams, flow charts, etc.) If you have an interest in this, please go out and file a Bugzilla entry and provide some use cases and examples.
We also had a great discussion about the use of JavaScript within BIRT. Everyone seemed to agree that JavaScript was the preferred language for most report developers, especially if there was the option of going to Java for more robust scripting requirements. As stated above, everyone would like to see better code assist and JavaScript debugging.
The final discussion centered around the use of EMF as a data source to BIRT reports. Bernie Bussiere has created a use case for this topic in Bugzilla at 132958. If you are intereseted in using your EMF model information to create and feed BIRT report designs go out and join the discussion.
Thanks to everyone who came out and made this such a good conference for the BIRT team.
scott
Wednesday, March 22, 2006
A Big Thankyou
In the BIRT In Depth tutorial for EclipseCon, I was assigned the task of providing some information about extending BIRT through the extension points. Unfortunately, I did not have time to go out and build the extensions, or at least I did not have time to build the extension and get any sleep or see my family.
Fortunately I discovered two published extension examples that I was able to incorporate into my demonstration. I wanted to say thank you to two BIRT users who created and shared their extensions for BIRT.
The first extension was a simple JNDI extension of the JDBC ODA. The submission by Victor and came to us through the newsgroup. If you are interested in using JNDI as a data source you can go to http://almatybeer.narod.ru/jndids/docs.htm to have a look at his site.
The second extension was done by Shawn Qualia, this extension uses the BIRT emitter extensioin to create an XLS document from a report design. You can get more information on the XLS emitter at http://qauck.blogspot.com.
Thanks to Victor and Shawn for sharing their work with us.
Scott
Greetings from EclipseCon, wish you were here
All,
Jason and I have been a little quiet lately as we prepared presentations for EclipseCon. I am sitting in on the third (and final) BIRT presentation at EclipseCon 2006. On Monday, Krishna Venkatraman, Jason and I all gave the first run of BIRT In Depth. We had about 45 attendees and went through a tour of all of the birt customization and extension points. We had a great response with lots of questions and great feed back.
On Wednesday Krishna started the morning presenting to a full room (150 people) showing a high level over view of BIRT capabilities, with a focus on what BIRT can do out of box. Krishna did a great job of presenting with a number of spontaneous bursts of applause.
Apparently, Krishna wet eveyone's appetite because next up was Jason Weathersby to provide a high level guide and demo of the BIRT extension points.
We will all be at the booth this afternoon.
This evening at 8:00 we are running a BIRT birds of a feather for anyone that has questions about BIRT, we have an open agenda, if you are at EclipseCon please drop by and we can talk about the use and function of BIRT.
Scott Rosenbaum
PS Jason and I will be working to take the slides, demos, and examples from the conference presentations and make those available to the entire community.
Tuesday, March 14, 2006
Eclipse BIRT Contest
In an effort to determine what cool things people are doing with BIRT and to encourage sharing within the community, the BIRT team is pleased to announce that we are now taking submissions for the Eclipse BIRT Contest.
What kind of reports are you constructing? How are you extending BIRT? How are you deploying BIRT? Here is an opportunity to showcase your wares with the possibility of winning a Sony PSP.
There are two categories of the competition. The first category is for style, which focuses on the presentation and aesthetic value of your submission. The second is for technical merit, which focuses on innovation either in report designs, APIs, extensions, or deployment.
The deadline for submissions is Friday, April 28, 2006. For details about prizes and contest details see Eclipse BIRT Contest.
Managing Unruly Newsgroups
The BIRT newsgroup has been a busy place lately. The newsgroup is averaging approximately 50 posts a day. At this rate we should reach 10,000 posts by the end of June, one year since the original release of the project.
Of course the effort to manage a newsgroup of this size is a daunting. The bigger issue is that it is very difficult to find the one nugget of information out there that will help people solve issues. It seems that the most expeditious approach is just to ask the question again.
I wonder if anyone has worked with any tools that allow better categorization and management of large newsgroups. Is there a way to assign posts to categories, short of creating a lot of sub-categories to the main group.
In particular does anyone have much experience with tagging of data? Has anyone ever used del.icio.us to manage a newsgroup? Is anyone currently managing tags to the BIRT newsgroup?
Any ideas would be great?
Wednesday, March 08, 2006
BIRT 2.1 M5 Build and the Callisto Project
The BIRT 2.1 M5 milestone build is the first installment in the 2.1 release schedule and is now available for download. BIRT 2.1 represents the BIRT component of the Callisto Simultaneous Release Project. The 2.1 release is primarily focused on adding the functionality required to match up with the other Callisto project releases. The full 2.1 project plan provides more details on BIRT 2.1.
The Callisto Simultaneous Release Project is an Eclipse project where ten of the major Eclipse projects will do a simultaneous release of their products. Callisto's goal is to eliminate uncertainty about project version numbers, and thus to allow ecosystem members to start their own integration, cross-project, and cross-product testing efforts earlier.
One new feature that is particularly interesting in the 2.1 release is the introduction of Joined Data Sets. Using this feature, BIRT developers will be able to combine simple Data Sets into an aggregate data set.
Tuesday, February 28, 2006
BIRT 2.0.1 Released
BIRT 2.0.1 has been released and is avaiable for download.
This release now supports Firefox 1.5. An issue with rendering PDF on Linux has also be addressed.
The Project Plan for BIRT 2.0.1 is available on the BIRT Website
Tuesday, February 21, 2006
Top N/Top M% BIRT Report Example
A new solution report example has been added to the BIRT website that shows off new filtering functionality. New operators were added to the BIRT filters, which allow you to specify Top N or Top M Percent of data results.
In the example there is a graph that list the Top N customers. This is achieved by setting the filter to use the Top N operator. This is pictured below: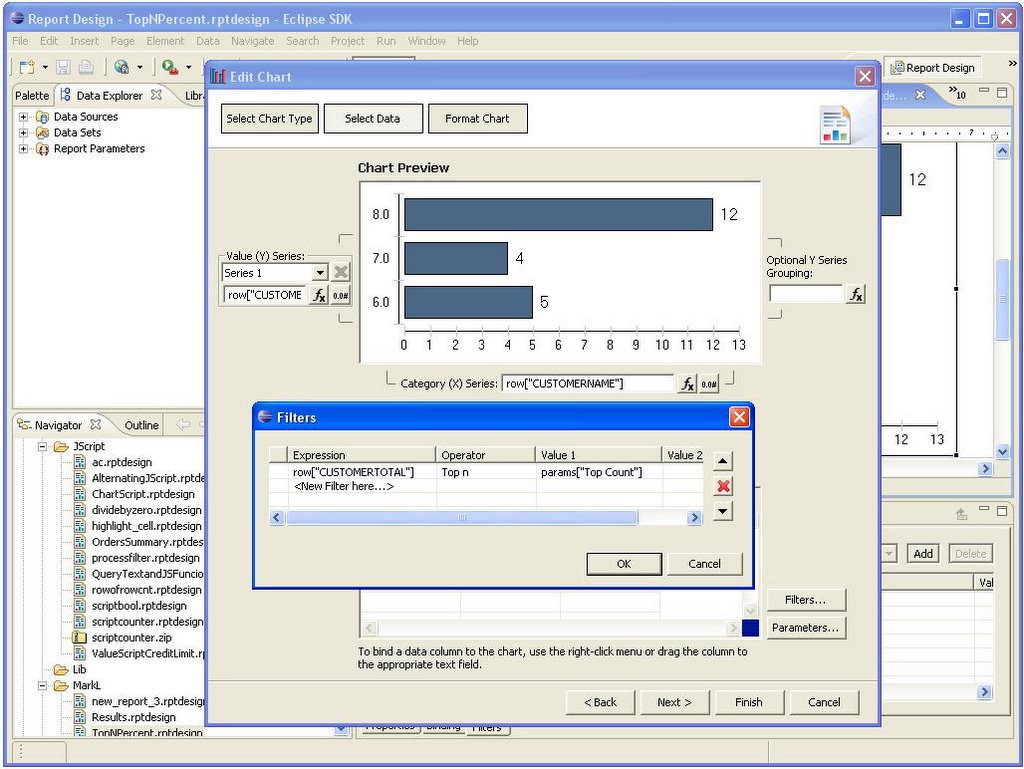
So this graph is taking the Customer Totals and filtering on the Top N, where N is passed in as a parameter to the report.
This report also has a table that list the Top M Percent Customers. This is achieved similarly to the graph and is pictured below.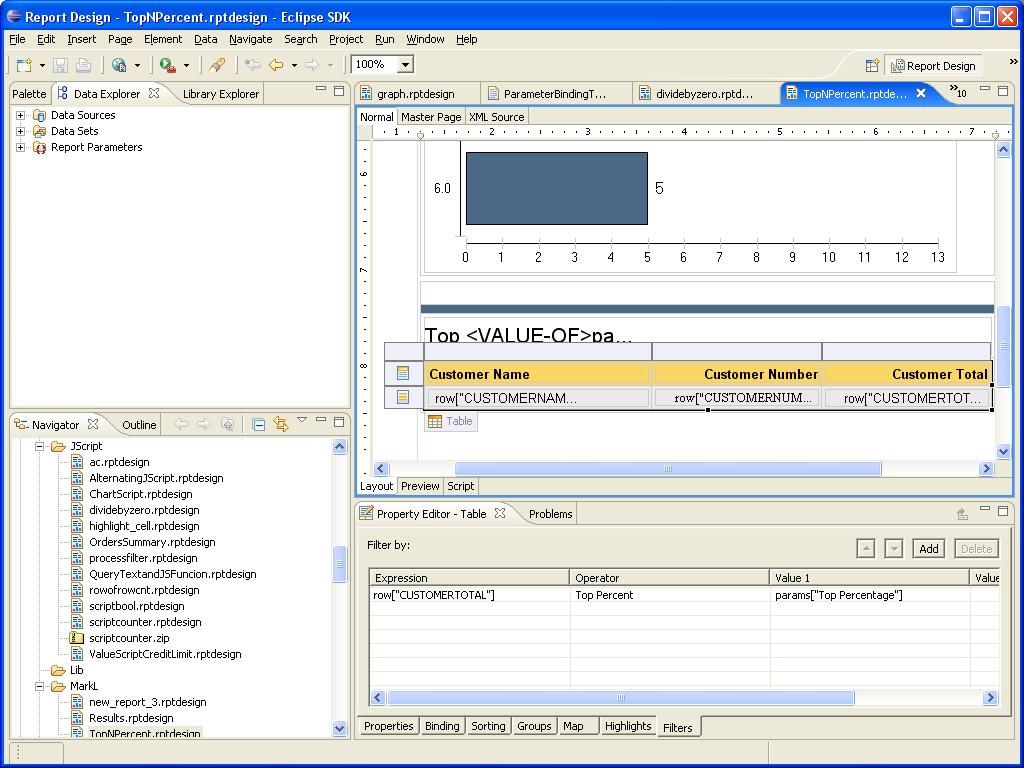
The final report is shown below. You can download the report from the BIRT Website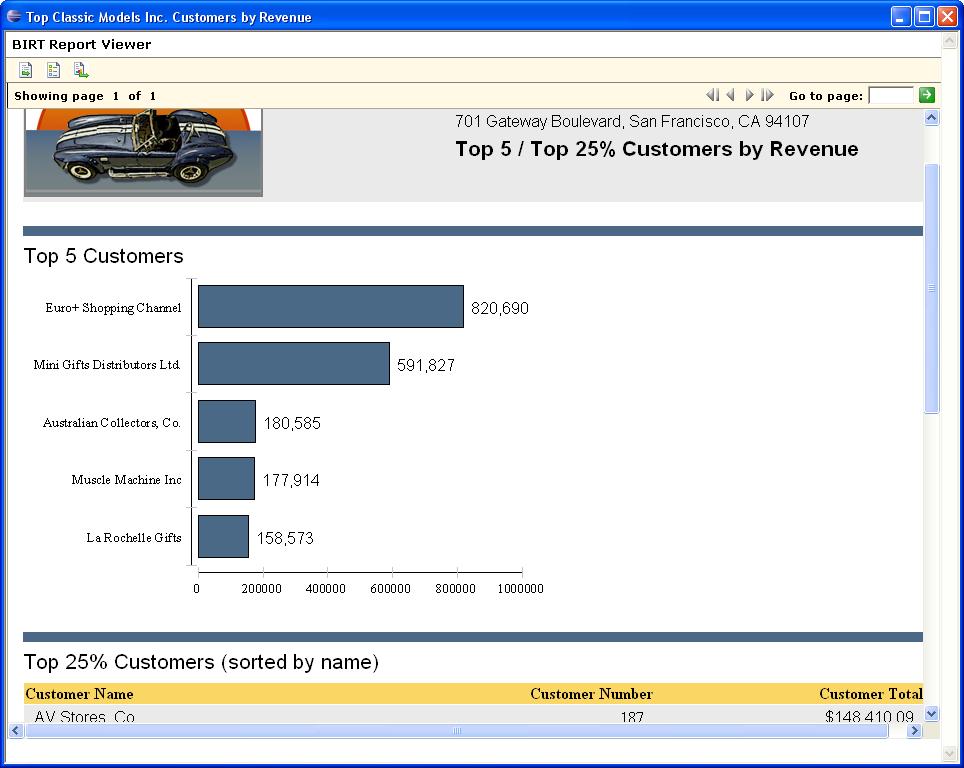
Tuesday, January 31, 2006
BIRT Web Site - Rises Again
Some of you may have seen that the BIRT web site was down for a while last week. A potential security issue was discovered in the old web site, so we were shut down. Fortunately, Jason Hellman had been working on a conversion to the new Phoenix style that has been adopted by the Eclipse Foundation.
Thanks to a late night (early morning?) by Jason Weathersby from the BIRT PMC, we were able to bring the BIRT web site up in the new Phoenix style. Thanks a lot to both of the Jasons (Weathersby and Hellman) for keeping the web site up.
We are currently trying to update the content in the BIRT web site to reflect the changes made by BIRT 2.0. Look for lots of new and improved content as we get things posted.
If anyone has a request for a particular type of content, or if they have content they would like to share with the BIRT community, let us know and we will do our best to help out.
BIRT Update Manager
The BIRT Dev team has added support to use the Eclipse update manager to get distributions of BIRT. To use this feature, use the Eclipse menu system to Help => Software Updates => Find and Install. This action will bring up the Features Update screen.
Click Next and get the following dialog
Select the New Remote Site option and get the New Update Site dialog, fill the dialog in as follows:
After adding the site, make sure the site has been checked and press Finish.
If this is a first time BIRT install you will get the following dialog:
Select the BIRT checkbox and click Next will bring you to the license screen, select Next again and you will be given a choice on where you would like to install BIRT. Click Next a final time and BIRT will be installed.
There are a coupe of things you should be aware of:
- At this time the update site seems to be slower than a download from one of the major distribution sites i.e. ibilio or TDS Internet Services.
- This option only downloads the birt-report-framework distribution. If you would like any of the other downloads (RCP, Runtime, Charts…) you will need to go through the standard download site.
- You are still required to download the Axis libraries, iText.jar and prototype.js files by hand.*
* We are very aware that the download of these files is a nuisance. We are working with the Eclipse Foundation to clear up the licensing of these products so that they can be included in the standard BIRT download. As soon as we clean up the process, we will let you know.
Monday, January 30, 2006
Swapping Databases at Runtime with BIRT 2.0
Swapping Databases at Runtime with BIRT 2.0
Often it is desirable to compose a report against a development system before promoting it to a production system. Although this could be done prior to BIRT 2.0, it required scripting. A new Database Property Binding editor is now available that speeds this process.
To use the Property Binding editor, edit the data source as shown below.
Select the Property Binding item.
Within this editor, the JDBC Driver Class, JDBC Driver URL, User Name and Password properties can be changed dynamically. The values for these properties can be typed in or entered through the BIRT Expression Builder, which is accessed by clicking the elipse icon ("...").
To swap the database at runtime the JDBC Driver URL will need to be modified.
In this example, this will be accomplished by adding a report parameter that determines if the report is to run in Production or QA. This parameter will be accessed in the expression set on the JDBC Driver URL property.
The JDBC URL is swapped based on the Production boolean parameter using this expression.
if ( params["Production"] ){
"jdbc:mysql://localhost/production";
}else{
"jdbc:mysql://localhost/qa";
}
That’s all there is to it.
Monday, January 23, 2006
Eclipse BIRT 2.0 Released!
The Eclipse Business Intelligence and Reporting Tools (BIRT) team is pleased to announce the release of BIRT 2.0.
Including over 200 enhancements derived from community feedback, BIRT 2.0 f eatures a new and improved viewer based on AJAX, which supports HTML pagination, CSV Output and Table of Contents functionality.
Other compelling features include template and library support, event coding in Java as well as JavaScript, Multi-pass Aggregates, Stored Procedure support and importing of Style Sheets.
To learn more about the notable features of BIRT 2.0 take a look at
New and Notable BIRT 2.0
We are also currently in the process of updating the web site and adding new examples to reflect the changes and show off the new features.
As always we appreciate any feedback.
Tuesday, January 17, 2006
Mike Fox Joins the BIRT PMC
The BIRT Team is pleased to have Mike Fox joining our ranks.
Mike has over 20 years of experience in software development and project management. He is currently the Technical Lead and Architect for the reporting components of IBM/Rational’s Team Products. Mike has been very instrumental in the progress of BIRT, and has demonstrated superior knowledge on the APIs and data access layers of BIRT. We look forward to having him on the committee.
Welcome to the team Mike.
Thursday, January 12, 2006
Deploying BIRT 2.0 RC to JBoss
Currently with BIRT 2.0 RC you need to download extra files to allow the viewer to work. These files are listed in the download section of the BIRT site. This means that if you are using the birt.war file, you will need to extract it and include the required files.
A quick option for deploying BIRT to JBoss is as follows:
1 - Download the Report Engine from Eclipse. Also get the additional required files.
2 – Extract the zip file into a temp location.
3 – Copy the Web Viewer Example directory to your JBoss installation, under the deploy directory for your configuration. Mine happened to be C:\jboss-4.0.3SP1\server\default\deploy.
4 – Rename the Web Viewer Example directory to birt.war, so it will deploy in place.
5 - Copy itext-1.3.jar file to the /birt.war/plugins/org.eclipse.birt.report.engine.pdf/lib
6 – Copy prototype.js to /birt.war/plugins/org.eclipse.birt.report.viewer/birt/ajax/lib directory.
7 – Copy the following six jars to the birt.war/WEB-INF/lib directory.
axis.jar
axis-ant.jar
commons-discovery-0.2.jar
jaxrpc.jar
saaj.jar
wsdl4j-1.5.1.jar
Start up JBoss and enter the URL to BIRT (ie http://localhost:8080/birt) and run the test report.
Friday, January 06, 2006
BIRT and Web Tools 1.0
For anyone that is using BIRT in combination with the Web Tools Project(WTP), you will need to be a little careful when you upgrade to the 1.0 version of Web Tools. The WTP is built on Eclipse 3.1.1. BIRT is based on 3.1. Under some environments, particularly Linux, the BIRT plugins are disabled when upgrading from Eclipse 3.1 to 3.1.1.
If after an upgrade to 3.1.1, you find that your BIRT perspective is no longer available. Go the Help --> Software Updates --> Manage and make sure that BIRT is enabled.
A second issue may come up with the EMF and GEF plugins. WTP 1.0 uses emf-sdo-xsd-SDK-2.1.1.zip , and the GEF-SDK-3.1.1.zip. BIRT needs to have the 2.1.0 version of EMF and the 3.1.0 version of GEF. Both version of EMF anclipd GEF can be installed in the same Eclipse installation with no apparent conflict.
If you are using the WTP all-in-one download, you will need to go out and pick up the 2.1.0 EMF and the 3.1.0 GEF downloads. They will need to be loaded into the plugins directory along with the BIRT download.
Scott Rosenbaum
BIRT Pmc
Wednesday, January 04, 2006
Eclipse BIRT 2.0 Release Candidate is available
Just wanted to drop a note to let everyone know the
BIRT 2.0 Release Candidate is now available. The main enhancement over the M3 release is the Viewer now supports paging HTML. In addition BIRT now supports property binding for the JDBC driver. This allows the report developer to change things like username, password, database or driver class at run time. BIRT 2.0 Final features continue to be polished. For a list of the 2.0 Features take a look at the Project Plan and Deliverables.

